How are Martian mountains measured?
by Lia Prins On maps, a mountain’s height is always shown solely as its peak’s elevation above sea level. This seems like a bit of a cop-out to me: is the mountain itself really that tall? Or is it just standing on the shoulders of a very tall plateau, so to speak? Then again, determining the base from which to measure any mountain seems like quite the slippery slope once you get down to it, so I do understand and sympathize with the sea level approach adopted by us Earthlings. But what about pinnacle-peppered planets and oceanless asteroids — (how) do we measure their mountains?


A baseless claim?
It’s true that no agreed upon or precise definition of a mountain base exists. In fact, there’s not even a universally accepted definition for “mountain” itself. Nonetheless, I’m certain that one of my geology-related homework readings from the previous millenium claimed that Mauna Kea — the volcano that forms most of the Island of Hawai’i — is taller than Mount Everest if you compare them from base to summit, since Mauna Kea’s base extends below sea level to the ocean floor. Assuming this decades-old elementary school assignment was justified in its claim, what threshold or criteria was used to constitute Mauna Kea’s and Everest’s respective bases?
In the case of Mauna Kea, its base turns out to be fairly apparent. As a shield volcano born of the Hawai’ian hotspot , its lava pillowed out to form an upward slope relative to the sea floor. Furthermore, the combined weight of Mauna Kea and its fellow volcanoes depress the oceanic crust below them by an estimated 8 kilometers (4.9 miles), which results in an underwater moat ringing the chain of islands, known as the Hawai’ian Trough. The bowing of the sea floor causes the surface outside the weight-bearing region to rise up even higher, forming an arch where the crust buckles upwards. This all makes it simple — though still somewhat subjective — to tell where Mauna Kea begins, so to speak. From the bottom of the Hawai’ian trough to its top, Mauna Kea comes in at about 9.7 kilometers (6.0 miles) tall.
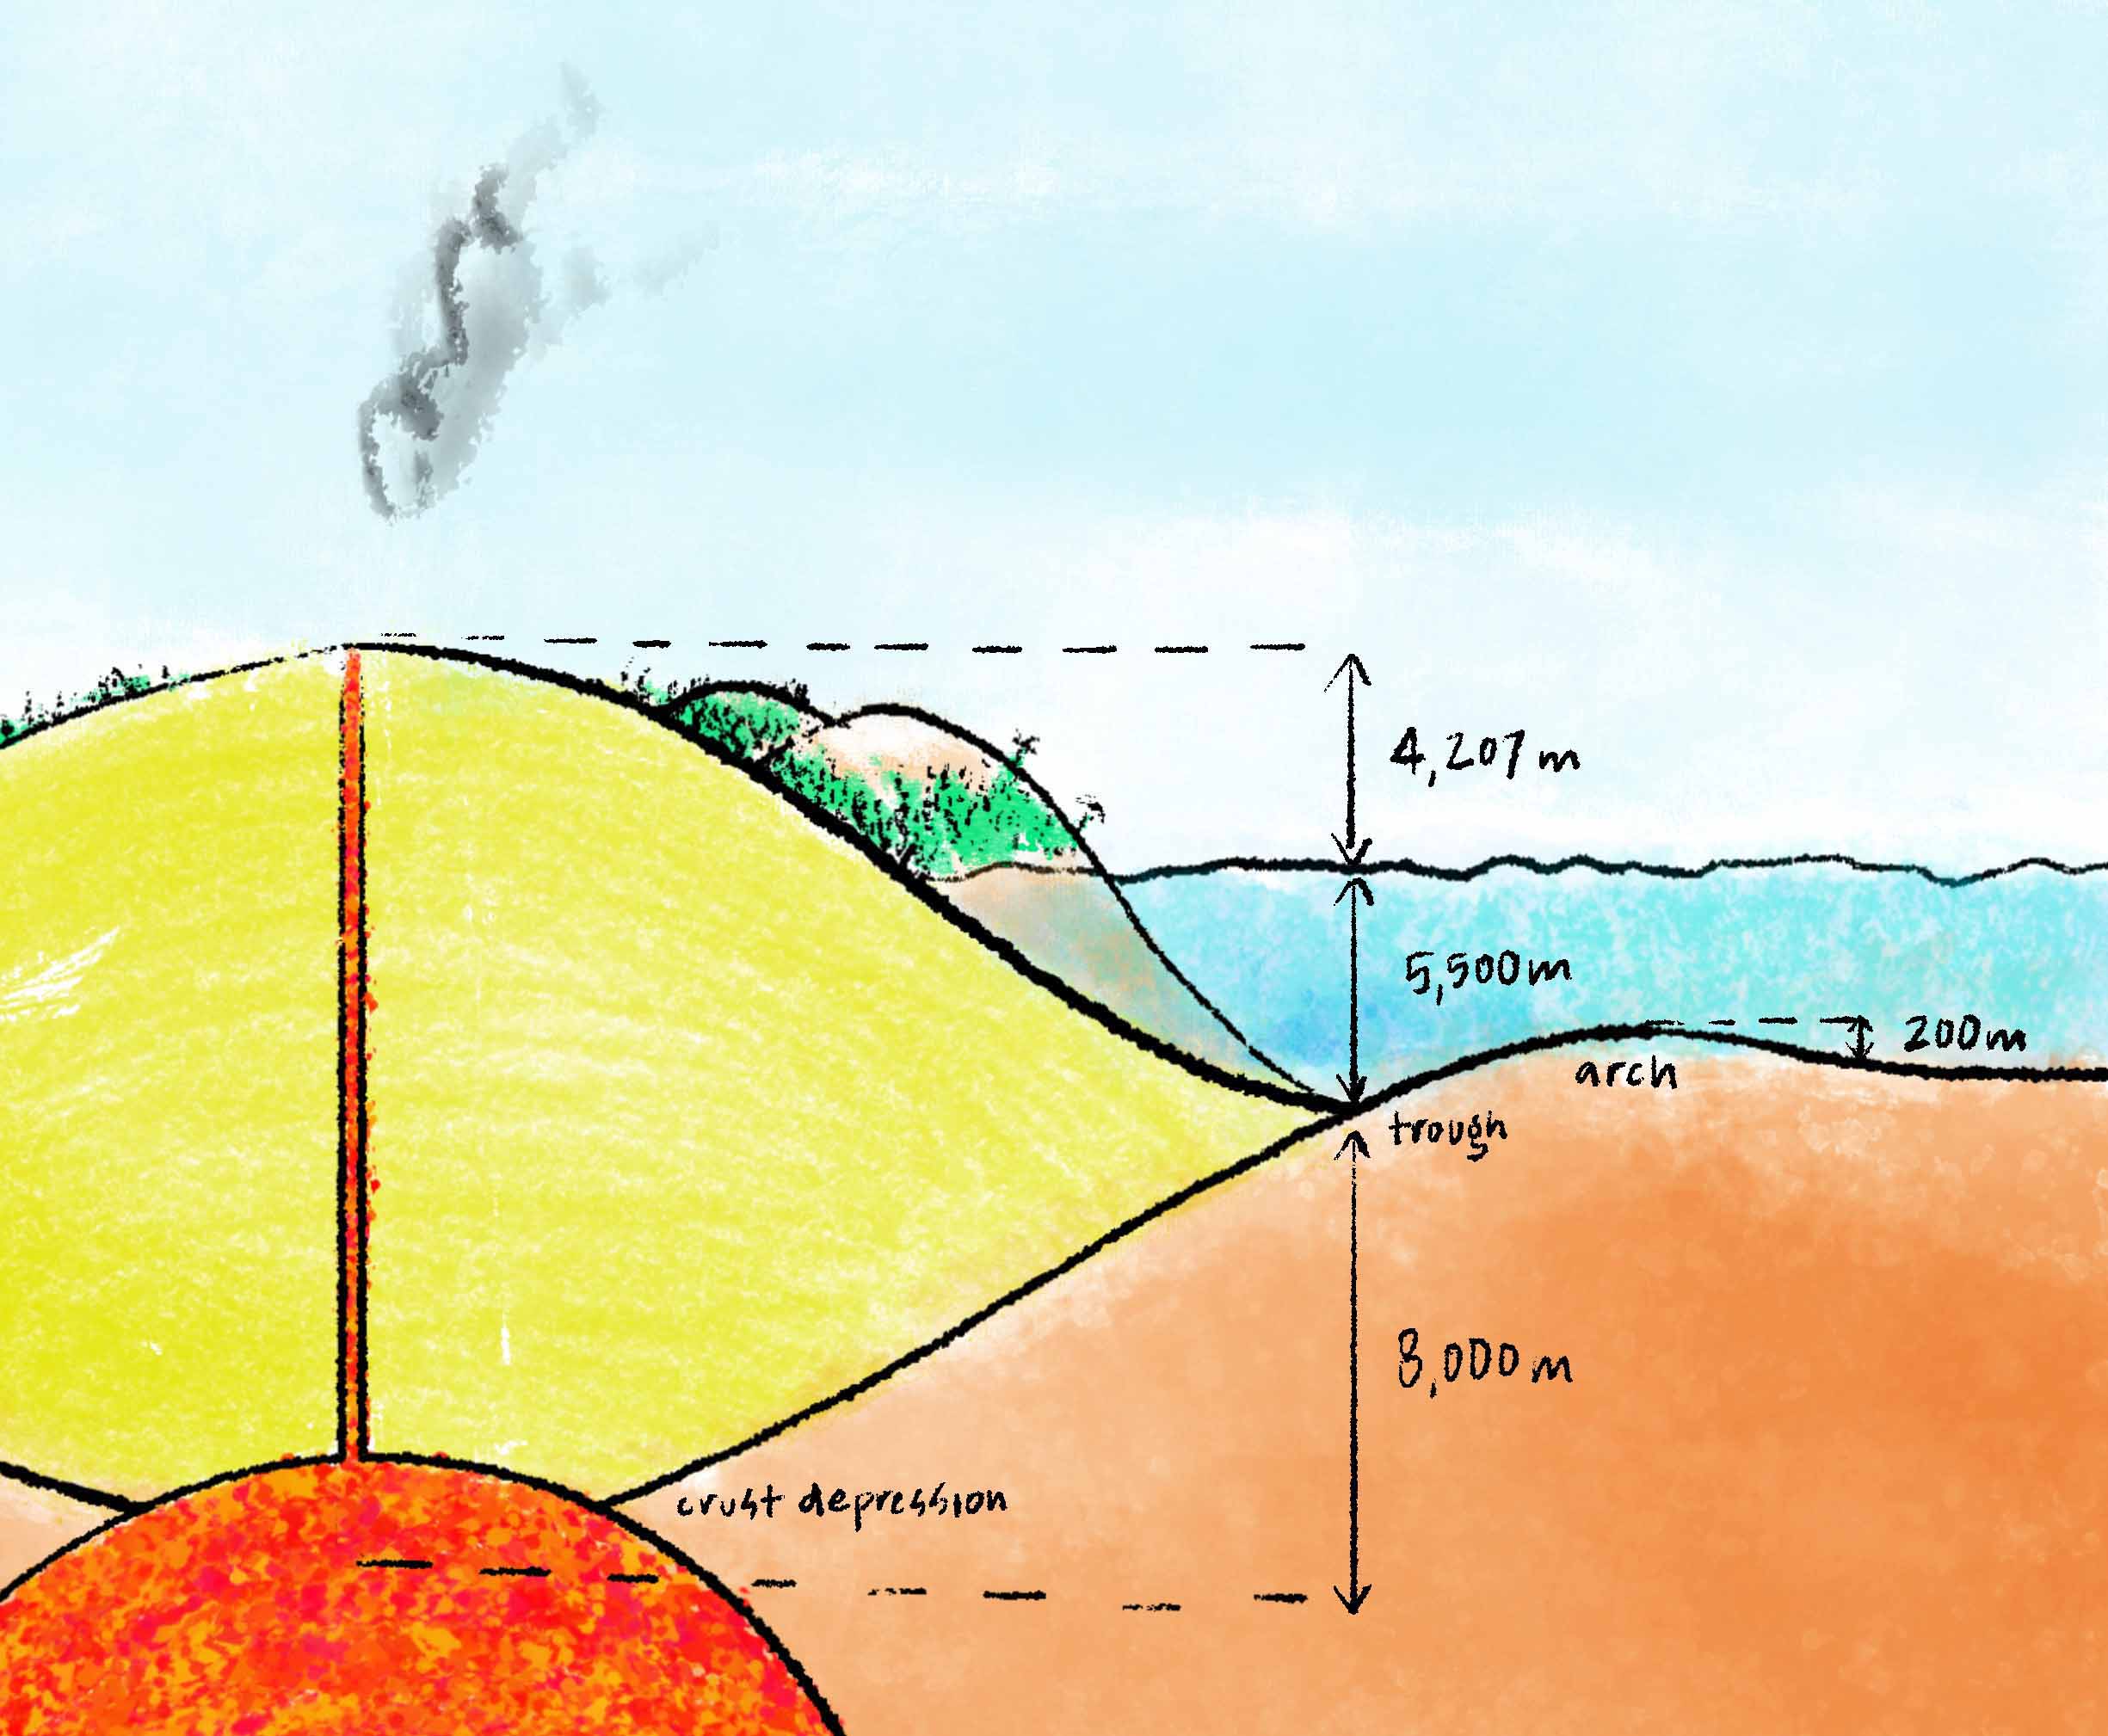

The Island of Hawai’i, which includes Mauna Kea as well as other volcanoes, is so massive that it puts a literal dent in the crust below it. This in turn results in a seafloor trough ringing the region, as well as an arch further out where the crust is raised about 200 meters (656 feet) above the rest of the seabed.(Note that the horizontal scale is squished so that I could fit everything in!)
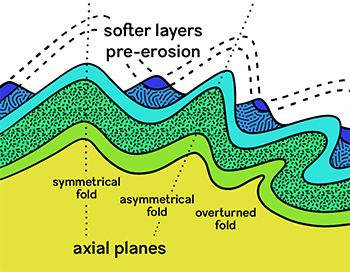
Mount Everest and other Himalayan peaks are fold mountains , resulting from the collision of the Australian-Indian tectonic plate into the Eurasion plate. The materials these mountains are made from more or less match those of the surrounding land, the way a wrinkle in a rug is made of the rug itself, although the crumpled nature of the Himalayan range does reveal older (and therefore normally buried) layers of the crust. This — and the fact that the “rug” from which it arises is itself not necessarily on a horizontal or flat “floor” — make Everest’s base a much more arbitrary call. Proposed base elevations for Everest range from 4.2 kilometers (2.6 miles) on its south to 5.2 kilometers (3.2 miles) on its north in the Tibetan Plateau, which — when averaged and subtracted from the peak’s 8,848-meter (29,029-foot) elevation — result in a summit-to-average-base height of 4,148 meters (13,579 feet).
-
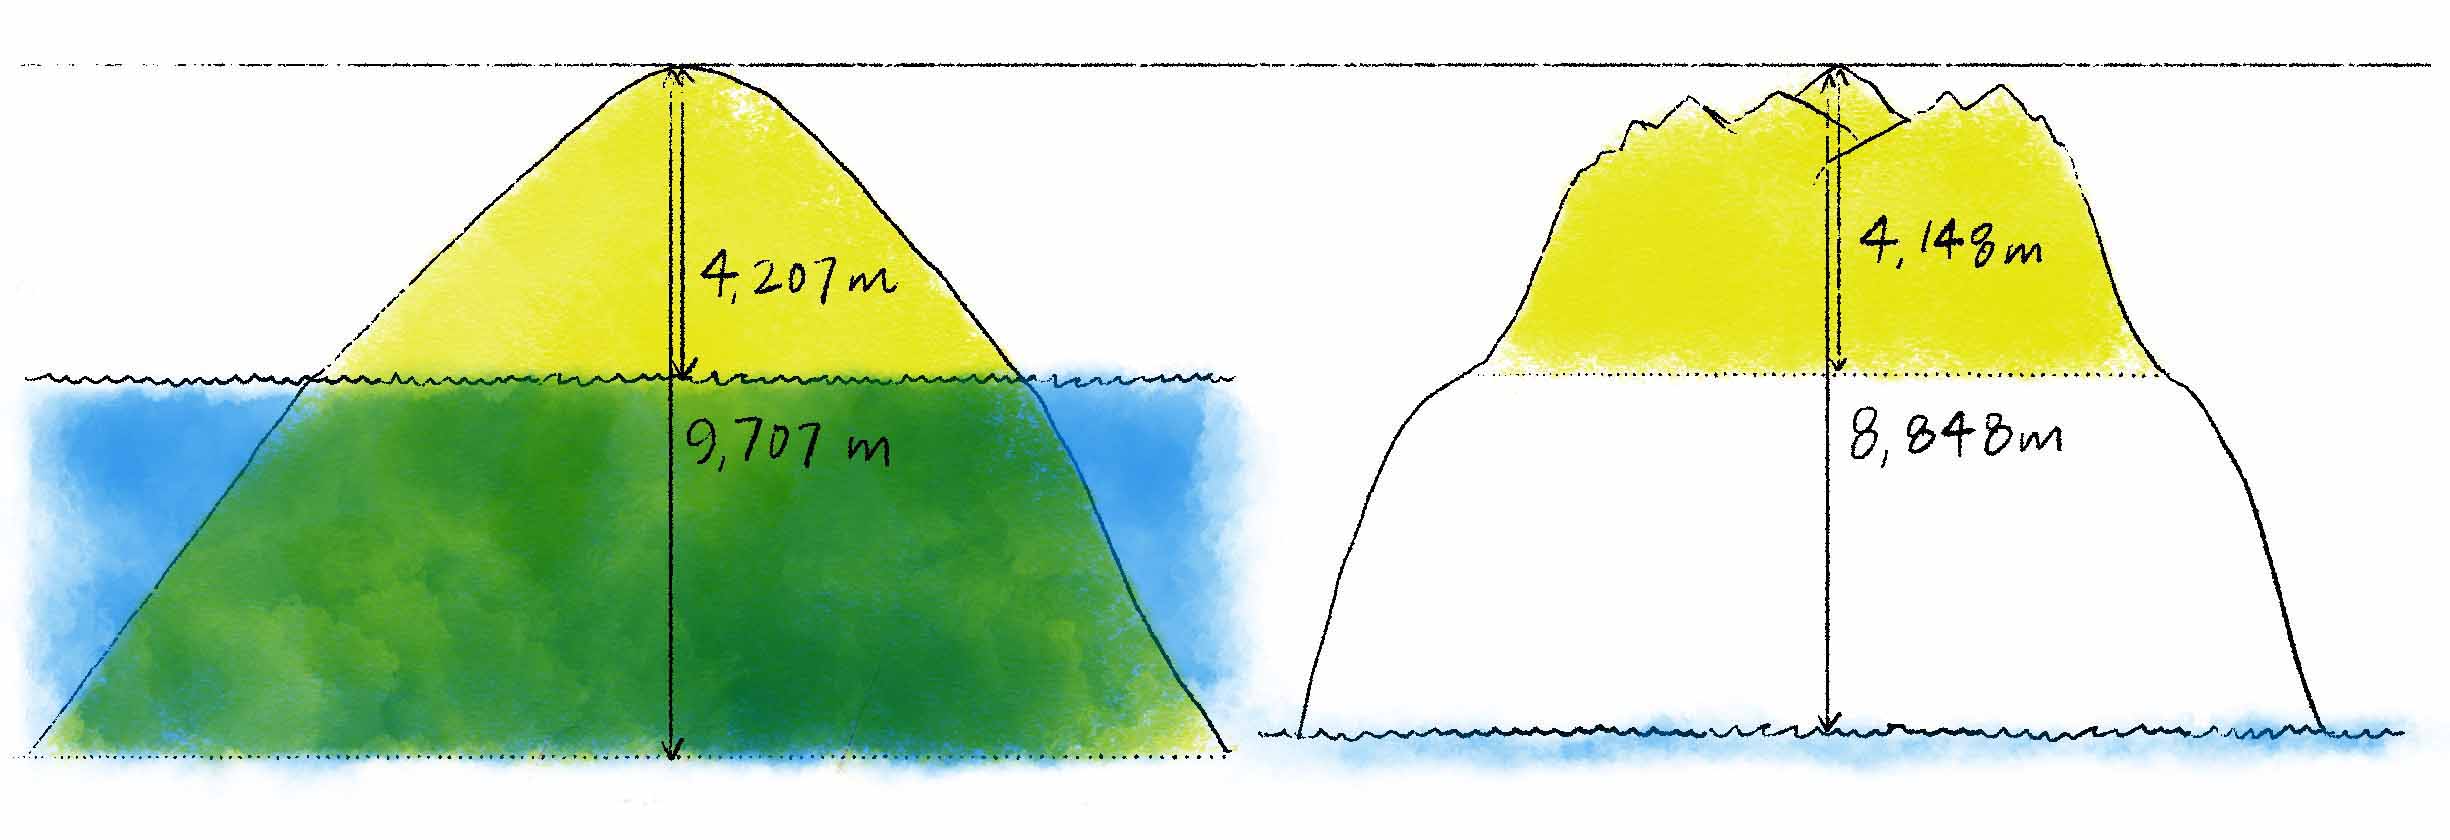
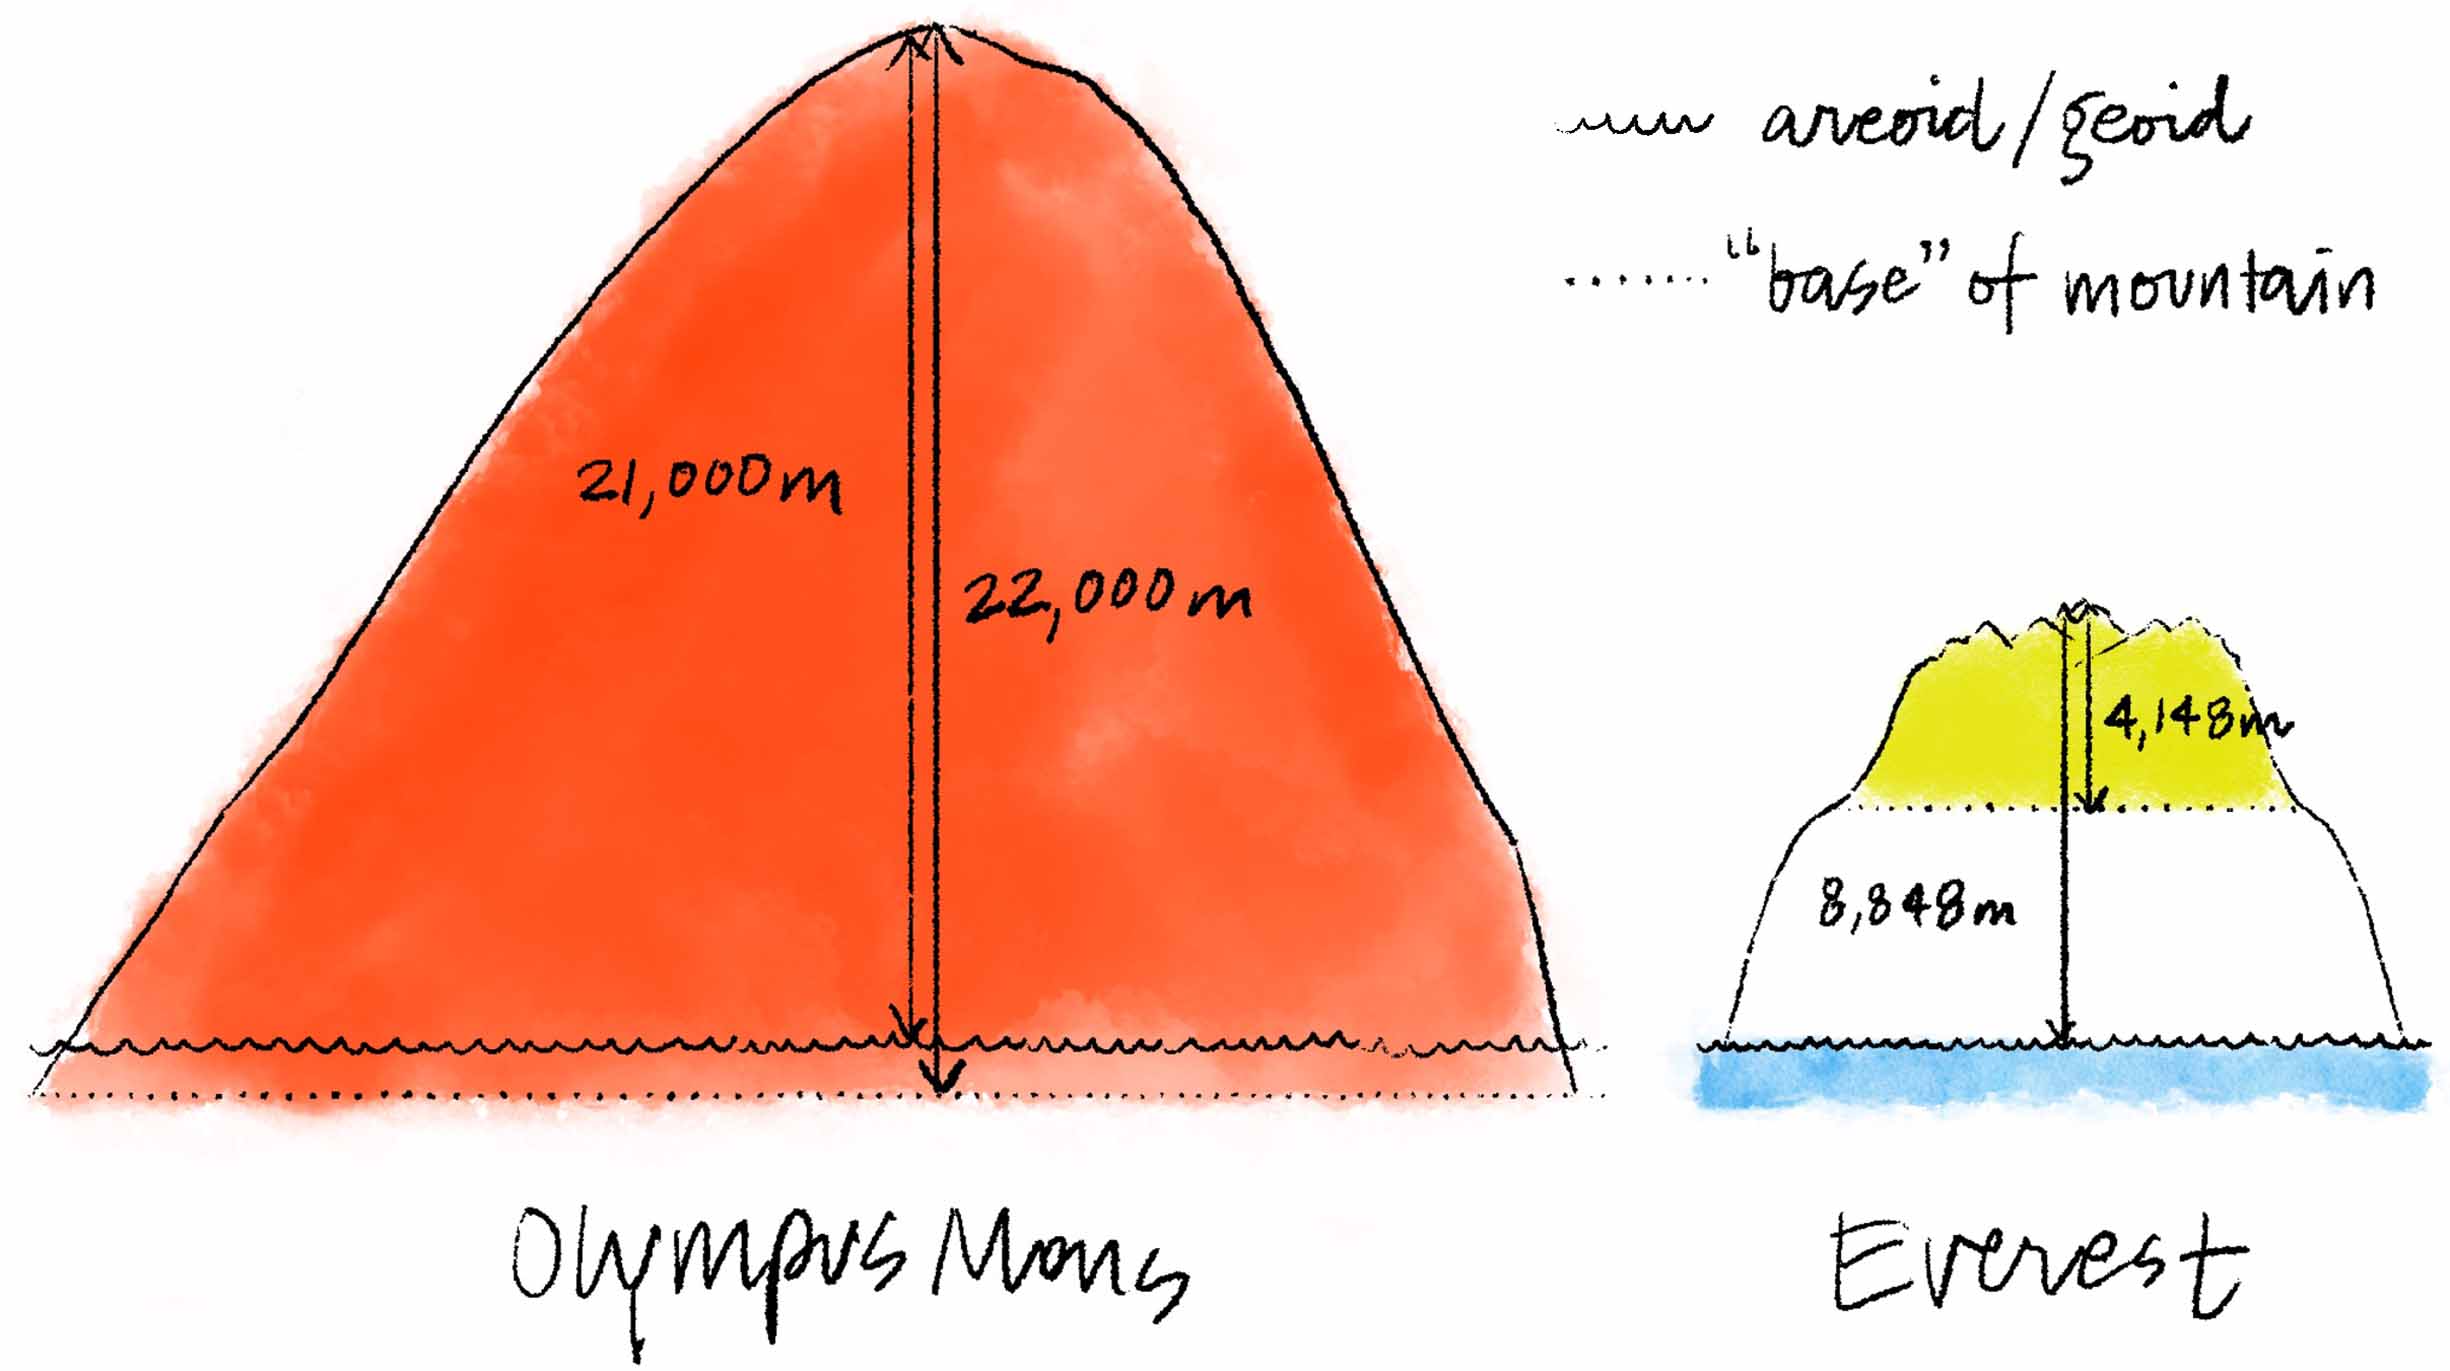
When Mauna Kea’s and Everest’s tops are aligned, it becomes apparent that their elevations and baselines are almost exactly inverted. (I compressed the horizontal scale for these three illustrations so that I could fit the two mountains side by side.) -
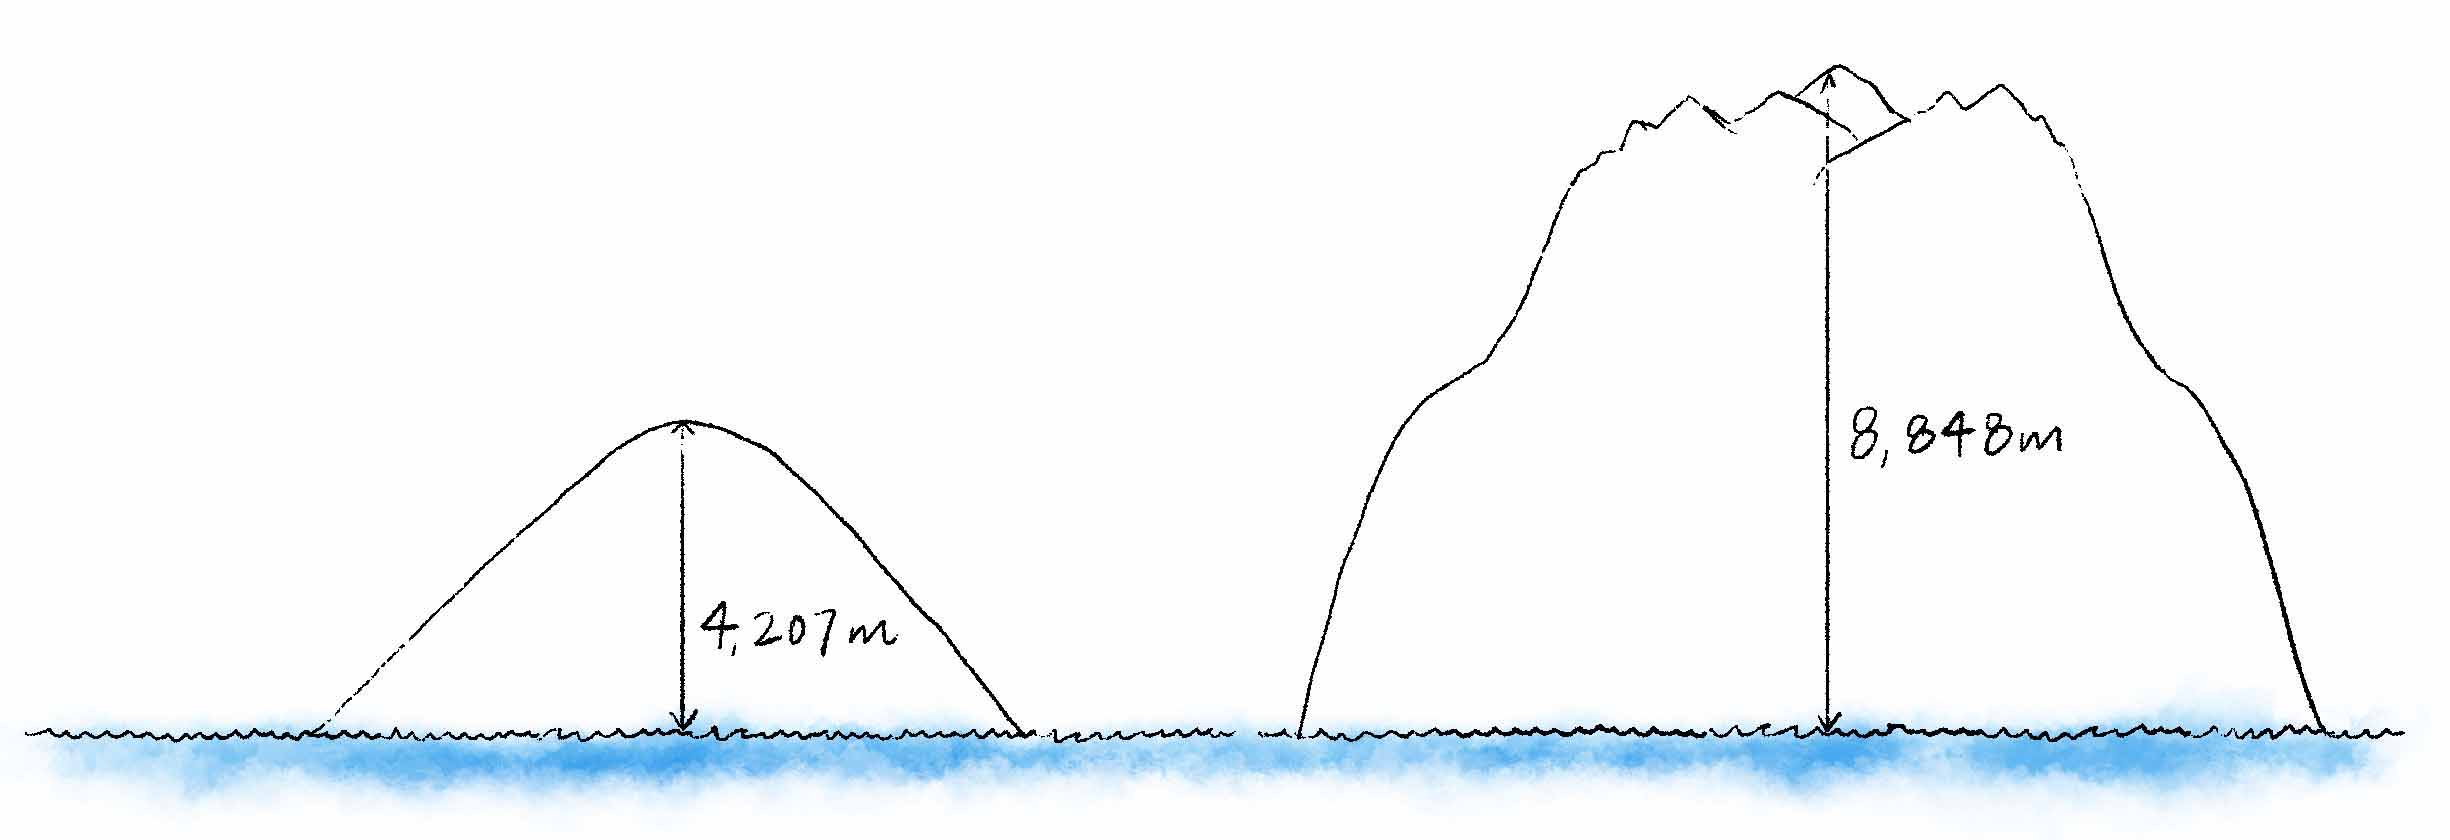
When aligning by sea level, Everest’s elevation is more than double that of Mauna Kea’s. -
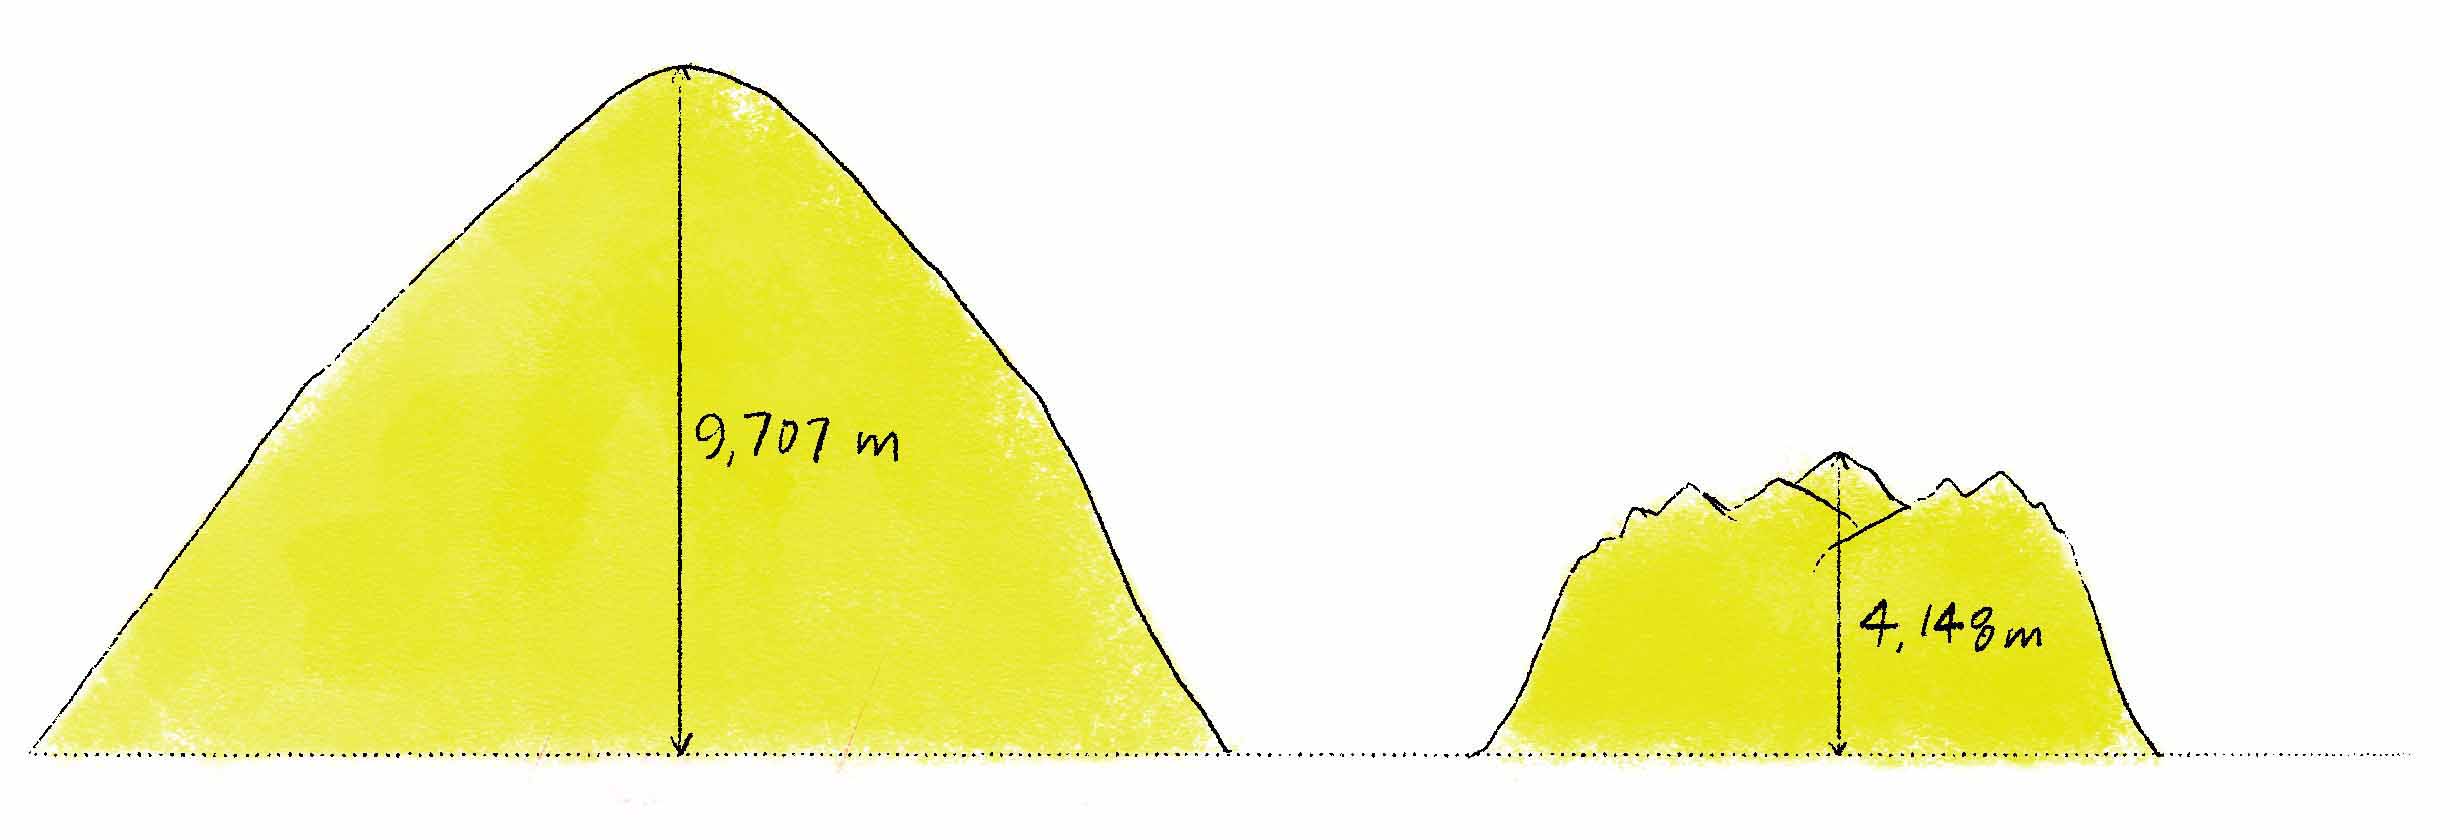
However, when we align their bases, Mauna Kea is over twice the height of Everest.
Leaving home base
Despite its uncomfortably abstract squishiness, this base-to-summit measurement method seems to work in some cases, at least conceptually. Given that many of the extraplanetary promontories that us Earthlings have come to be aware of are volcanic in origin (and as we’ve seen in the case of Mauna Kea and Everest, a volcanically created peak generally lends itself to a much more apparent base than mountains and ranges caused by tectonic forces), perhaps this approach can be applied to extraterrestrial mountains, too?
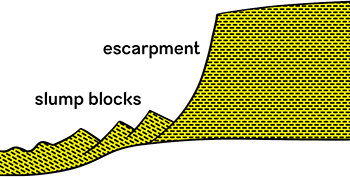
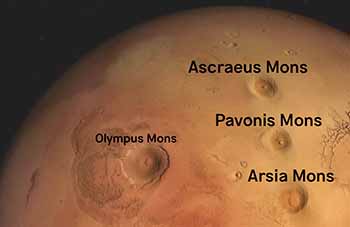
Mars is the perfect planet to start with, as it’s propagated a number of truly massive shield volcanoes, many plenty heavy enough to crush the crust beneath and around them into indentations — just like the Hawai’ian islands do. Several are also sharply defined by sheer escarpments — 8 kilometers (5 miles) high in some places — that aid in creating distinctive thresholds with which to delineate the volcanoes’ boundaries. These cliffs are likely the result of erosion at the outer edges of past lava flows. However, the bases of these pedestal-like scarps surrounding the peaks’ perimeters are at different heights relative to each other, so it’s still tricky to determine where to set the starting point of each mountain. Nonetheless, Olympus Mons is easily Mars’ tallest mountain, coming in at nearly 22 kilometers (13.7 miles) from the foot of its northwestern cliffs to its peak. Despite its height, it has an average slope of just 5 degrees, spreading over a footprint of 300,000 square kilometers (120,000 square miles), roughly the area of New Mexico. It’s so large that, according to astrophysicist Neil deGrasse Tyson, “you could be on its slopes and you would not know [it] … the base is so huge before you get to its summit.” 1
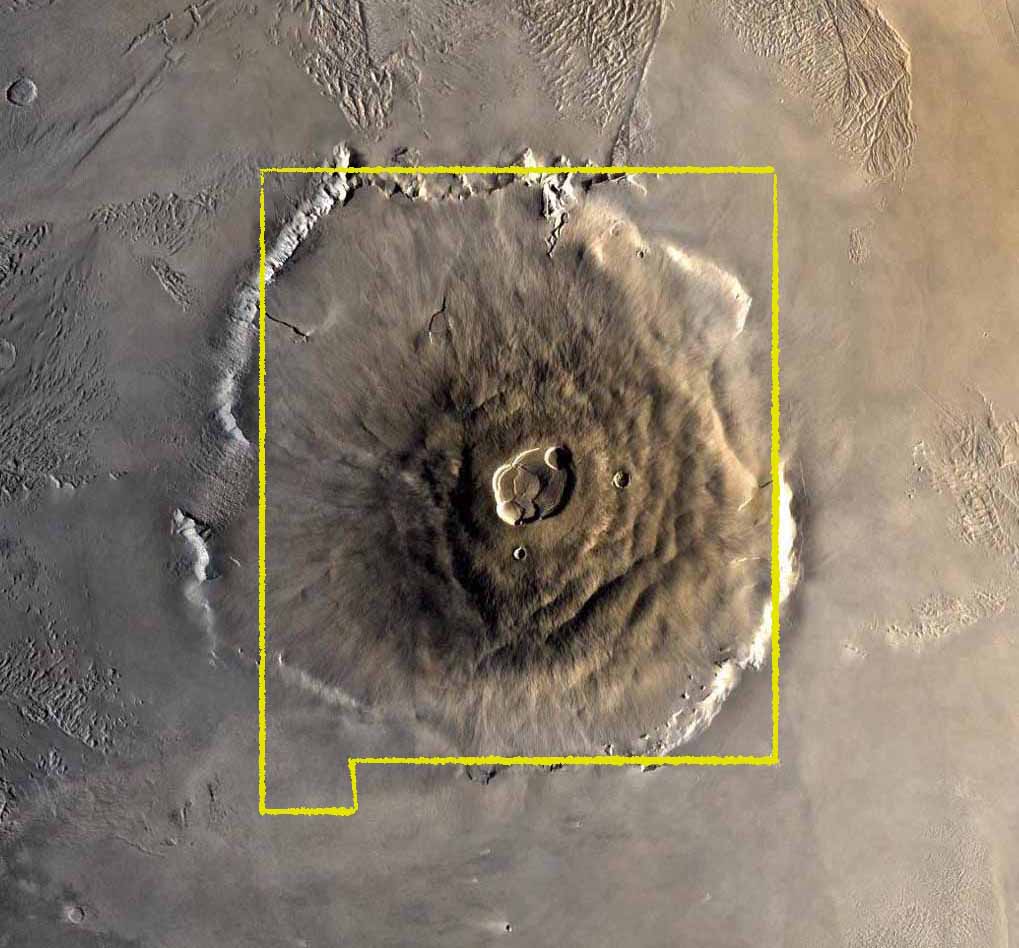
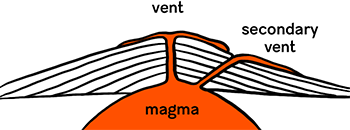
Olympus Mons’ footprint falls only about 4,400 square kilometers (1,700 square miles) short of New Mexico’s.Image credit: NASA; New Mexico outline added.
The mountain that came from outer space
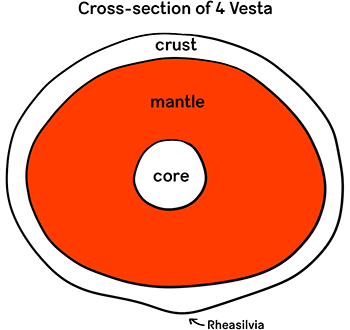
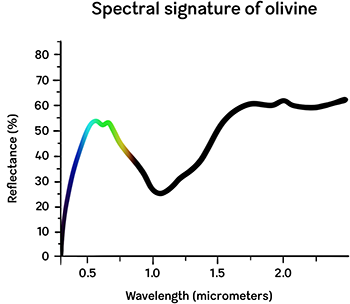
Volcanoes aren’t the only way that interplanetary peaks come to be, though. With an average width of just under 530 kilometers (or 330 miles), 4 Vesta is the second-largest known asteroid within our Solar System. It hosts a crater called Rheasilvia that takes up most of its southern hemisphere, the bottom of which lies about 13 kilometers (8.1 miles) below the surrounding surface. Rheasilvia likely formed from a collision so colossal that the impacting body made its way through several layers of crust and possibly even into 4 Vesta’s mantle , as evidenced by spectral signatures of olivine — the primary mineral composing Earth’s own mantle — captured by the Hubble Telescope. Beneath layers of post-pummel debris, the remnant of the impacting body itself forms the foundation of a soaring summit at the center of the crater. This peak is essentially deadlocked with Olympus Mons for tallest known mountain in the Solar System: 2 both behemoths’ undulating surroundings — and therefore the large margins of error surrounding their extremely approximated baselines — make it impossible to objectively discern which deserves the honor.
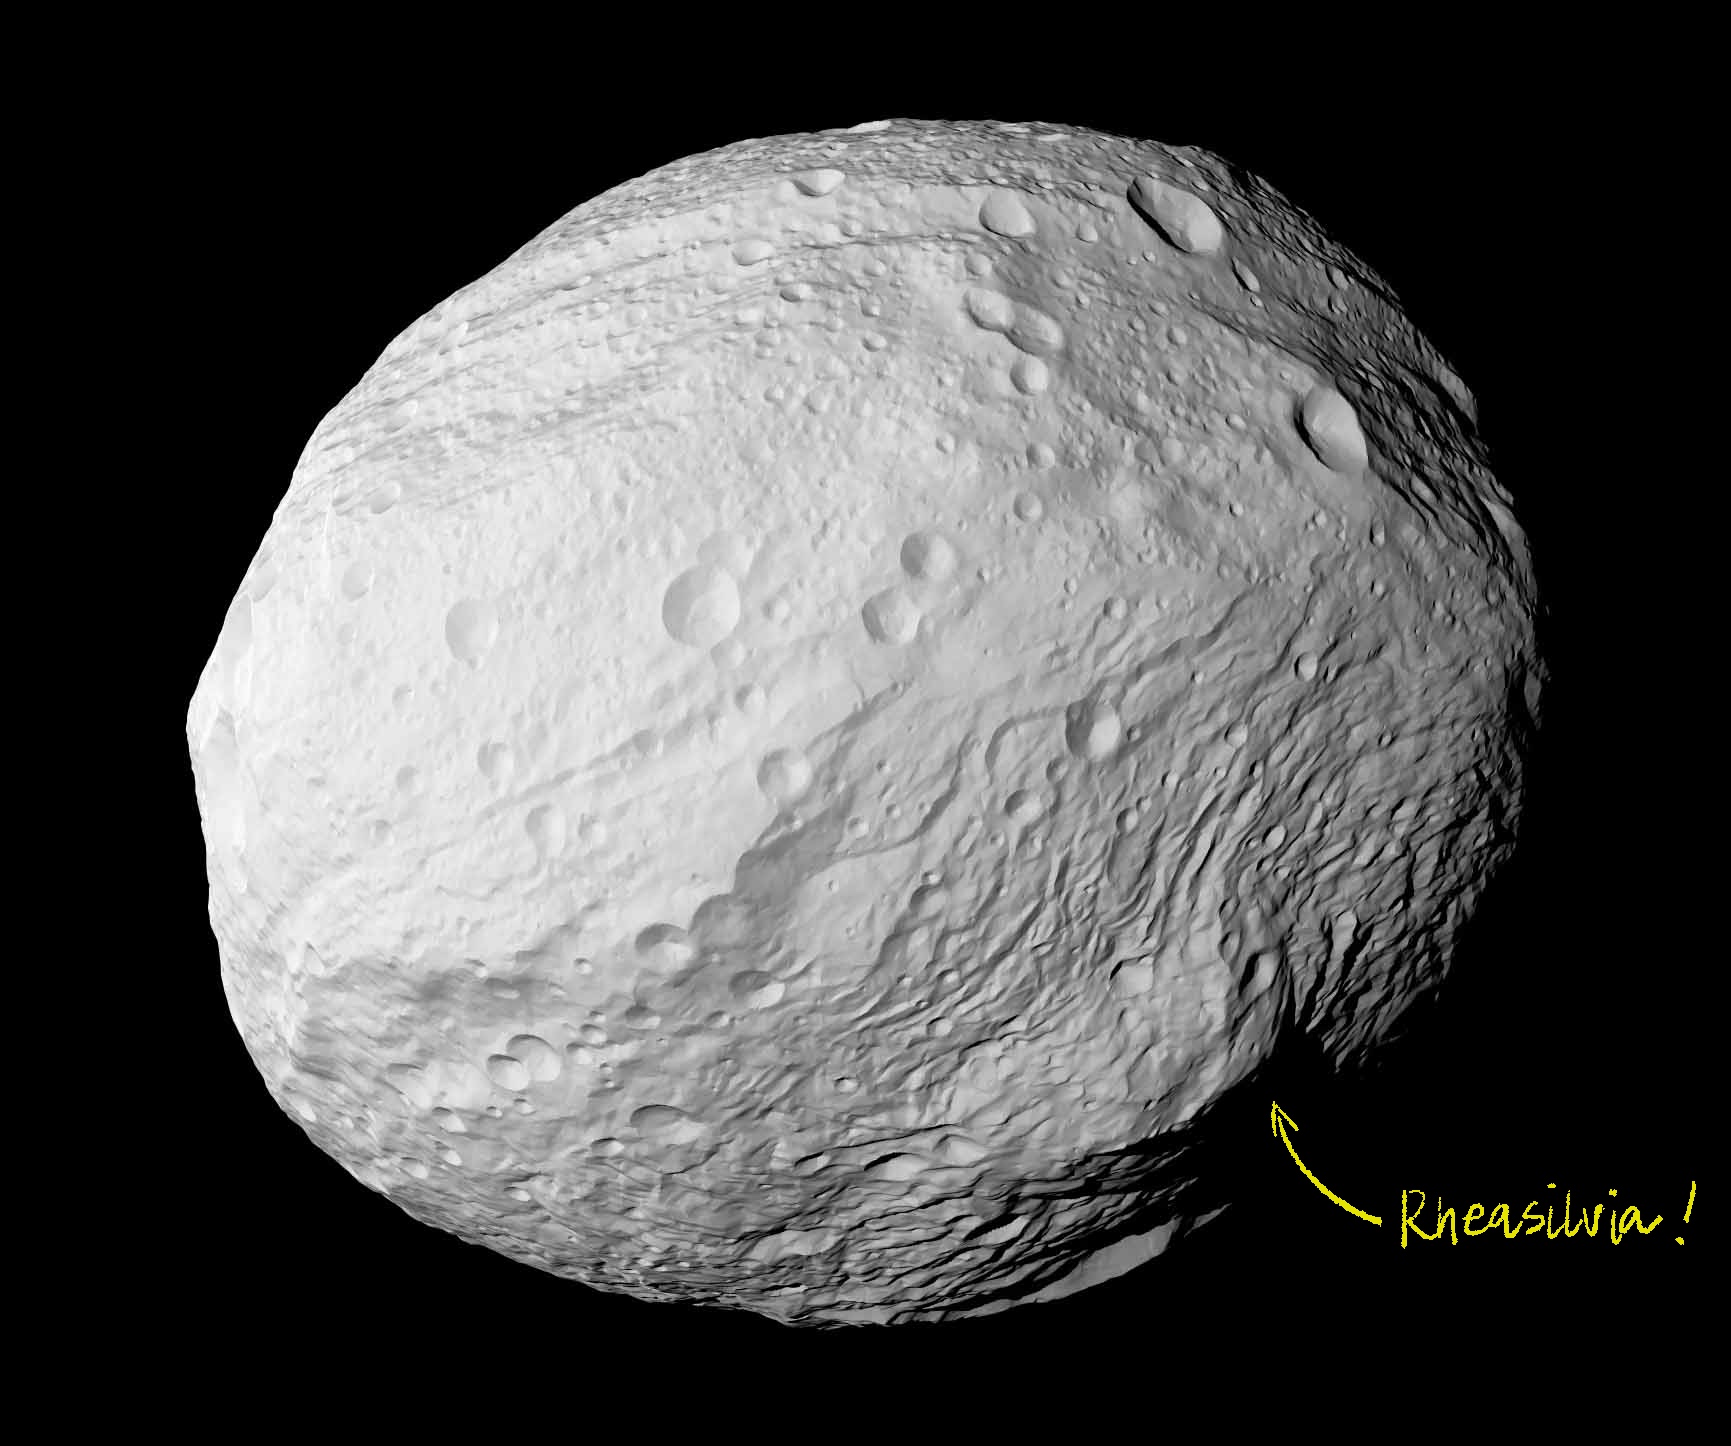
Rheasilvia forms a very visible bulge near 4 Vesta’s southern pole.Image credit: European Southern Observatory
Clearly, a mountain’s base-to-summit height is significantly subjective, even if there happen to be cooperative geological features at play like troughs, craters, or cliffs. While this measurement method may result in an interesting — if conceptual — trait of the peak in isolation, it neglects to capture the global context.
Earth as an ellipsoid
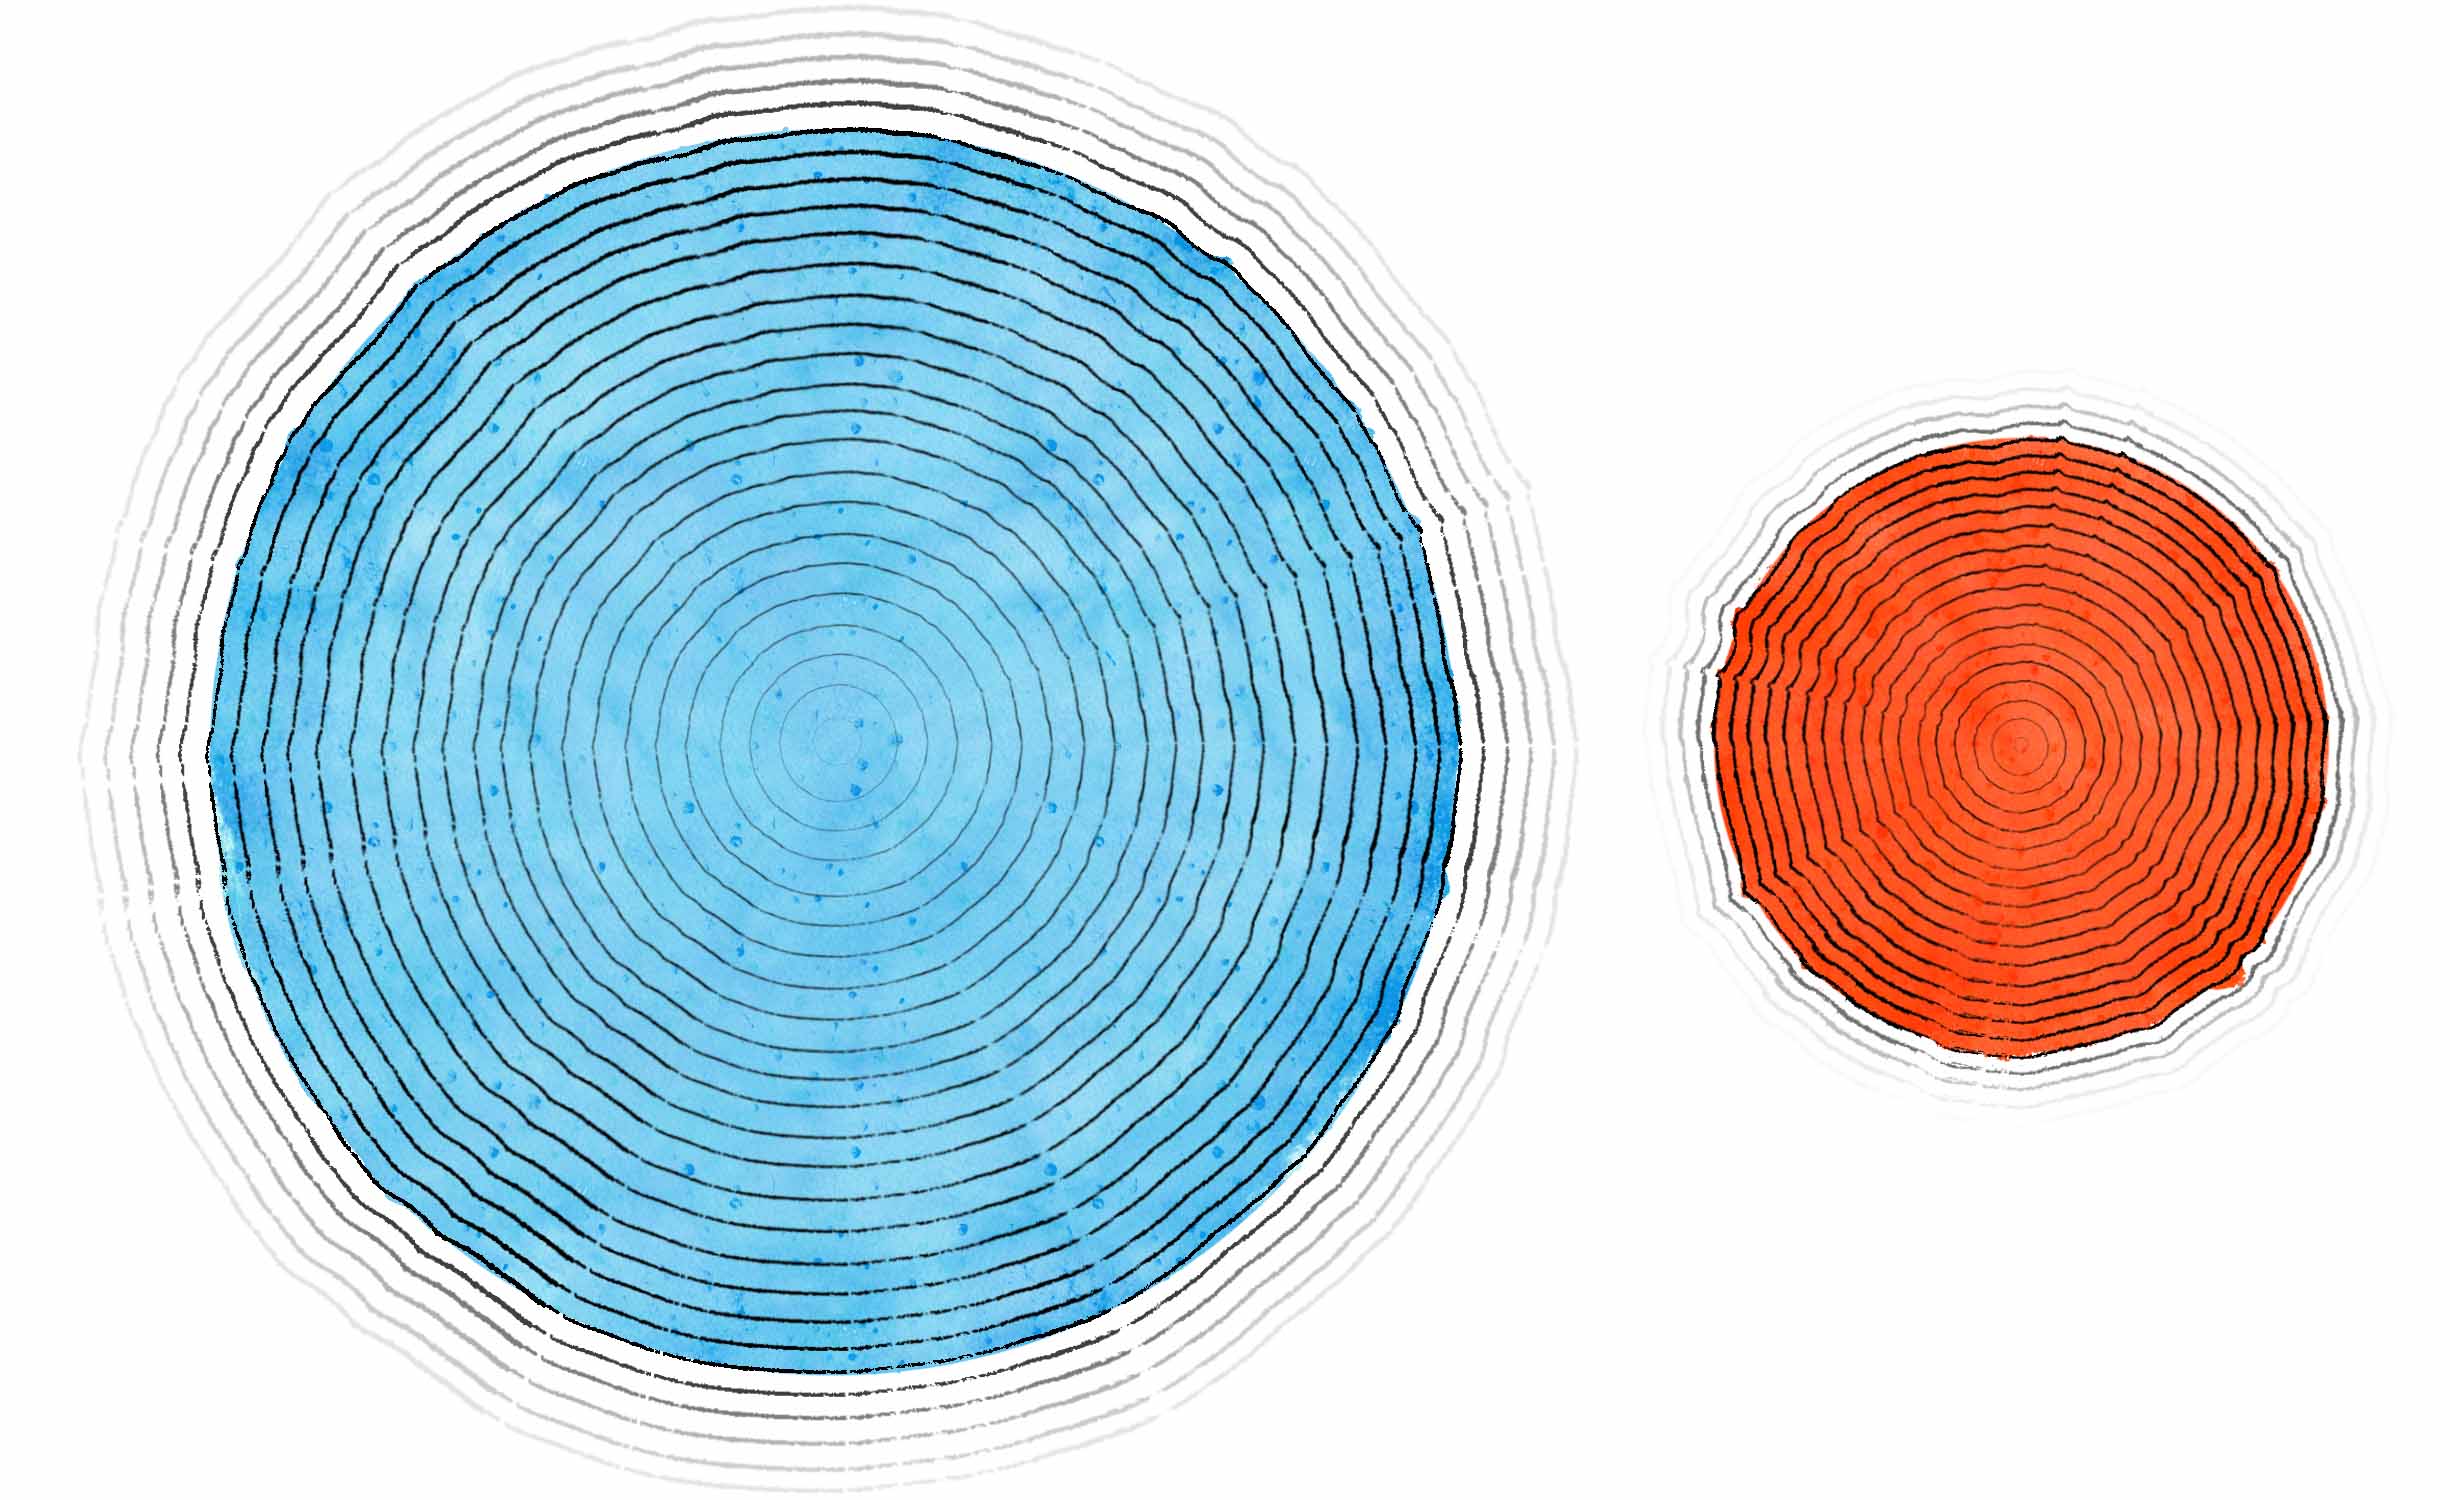
Unlike the base-as-a-baseline approach, sea level excels at accurately plotting a peak’s height relative to the rest of the world. This metric has been a reliable reference point throughout the history of height measurement, providing an ostensibly consistent surface from which to determine elevations. According to the National Geodetic Survey — a branch of the National Oceanic and Atmospheric Administration responsible for establishing latitudes, longitudes, elevations, and shorelines in the US — sea level is defined locally, via various tide surveying stations. Each is constantly collecting sea level data for its own region. Mean Sea Level (MSL) is then defined for each locality by averaging those measurements over the course of 19 years, “the period over which the pull of the sun and the moon on the earth completes a full cycle.” 3 In theory, sea level serves as the stalwart starting point from which to map the elevations of disparate global locations. But in practice, it’s not quite so simple. It helps here to first have a bit of context about Earth’s overall shape, to better understand the disparity between theoretical and practical sea level. Our planet is not a perfect sphere: all distances from its center of mass to its surface are not equal, and not just because of the bumps caused by the very mountains we’re seeking to measure. Earth’s diameter from pole to pole is about 42.8 kilometers (26.6 miles) shorter than its equatorial diameter — a difference of about ⅓ of a percentage point — which makes our planet an ellipsoid or an oblate spheroid, geometrically speaking. 4
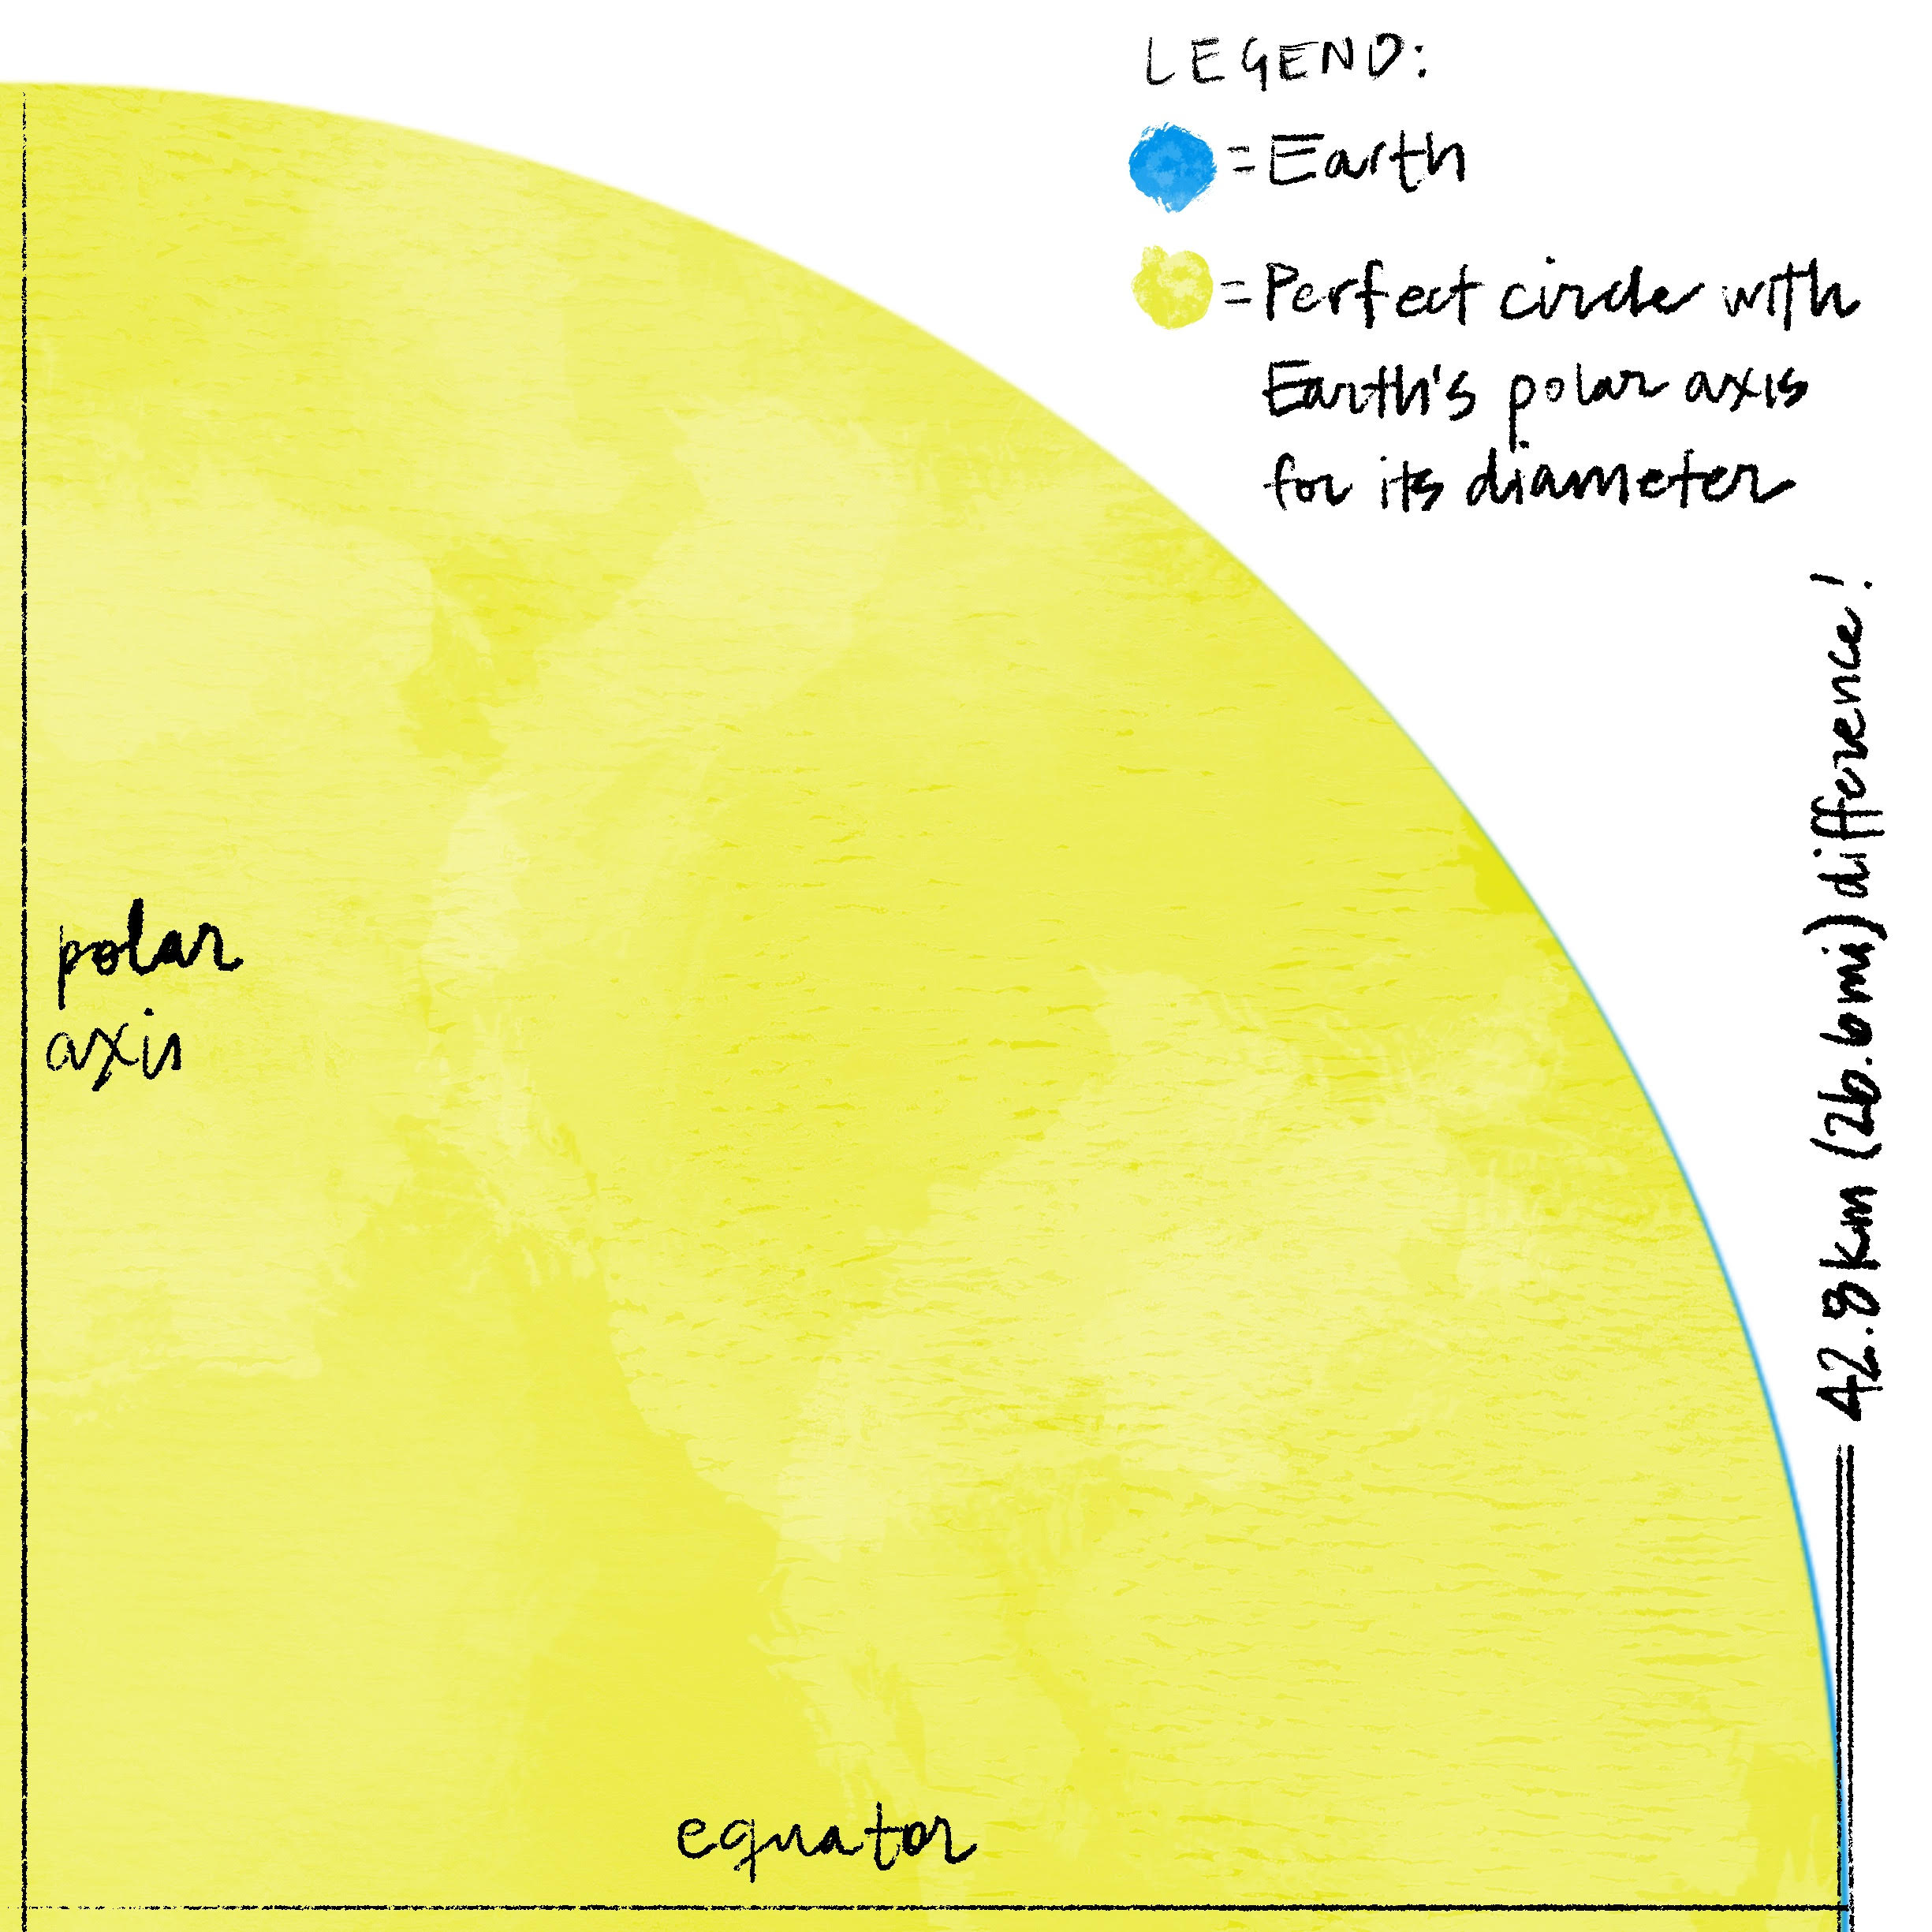
Earth bulges seemingly imperceptibly at its equator; the difference between its ellipsoidal shape and a perfect sphere is shown in dark blue.
Earth is just shy of spherical because it spins. The further a point is from its axis of rotation (like a location along the equator), the faster that point must travel through space, compared to points that are closer to the axis (like those nearer the poles). This difference in relative speed results in a phenomenon called centrifugal force . Over time, this bit of extra force has flung Earth’s innards outwards, which has led to a slightly deformed spheroid shape.
After averaging away tidal pull, currents, and weather-induced waves, one would expect the oceans to settle into a flat, global plane — the very embodiment of the ellipsoid model. However, even after accounting for 19-years-worth of tides, this appears not to be the behavior of our seas.
To quote spatial analyst Witold Fraczek: “The reference ellipsoid was intended to closely approximate the MSL; it was surprising when the figures differed greatly.” This wasn’t realized until relatively recently, when the TOPEX/POSEIDON satellite — launched in 1992 expressly to capture surface altitudes — revealed that sea level, even after time-averaging, differed from the ellipsoid by as much as 100 meters (330 feet) in some spots. 5 In other words, our oceans appear to have hills and valleys of their own.
Sea level doesn’t seem level
What keeps sea level from spreading out evenly over Earth’s ellipsoidally averaged surface? It actually turns out to be gravity that is not evenly dispersed across the earth, and the seas in turn reflect this. Earth’s crust varies invisibly in its density: in some places comprised of hollow caverns, porous layers, or water-logged aquifers, all of which are much less dense than solid rock — but even rock differs in density from type to type significantly. Moreover, to quote the National Geodetic Survey, “Mountains have greater density and, therefore, cause greater gravitational acceleration than valleys that are mostly filled with air. … If it has lower density than its surroundings, it produces less gravity.” 6 And it is gravity that supplies the very characterization of a level surface: like the tool of the same name, level is defined as perpendicular to the gravitational field. Therefore, though the oceans may appear to undulate unevenly, given that they do so in response to Earth’s gravity, they are in fact level by definition.
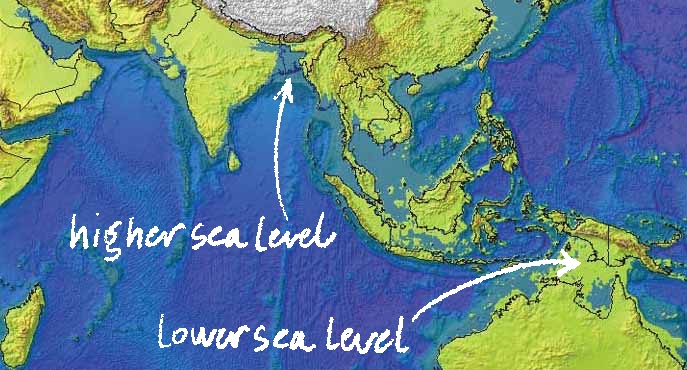
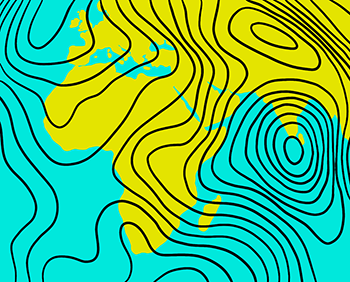
A world with no gravitational anomalies — in which the mass of the Earth is distributed completely homogeneously — would result in new shorelines, shown in green. Sea level would lower between New Guinea and Australia, but rise to cover Bangladesh.Image credit: Environmental Systems Research Institute; annotation added.
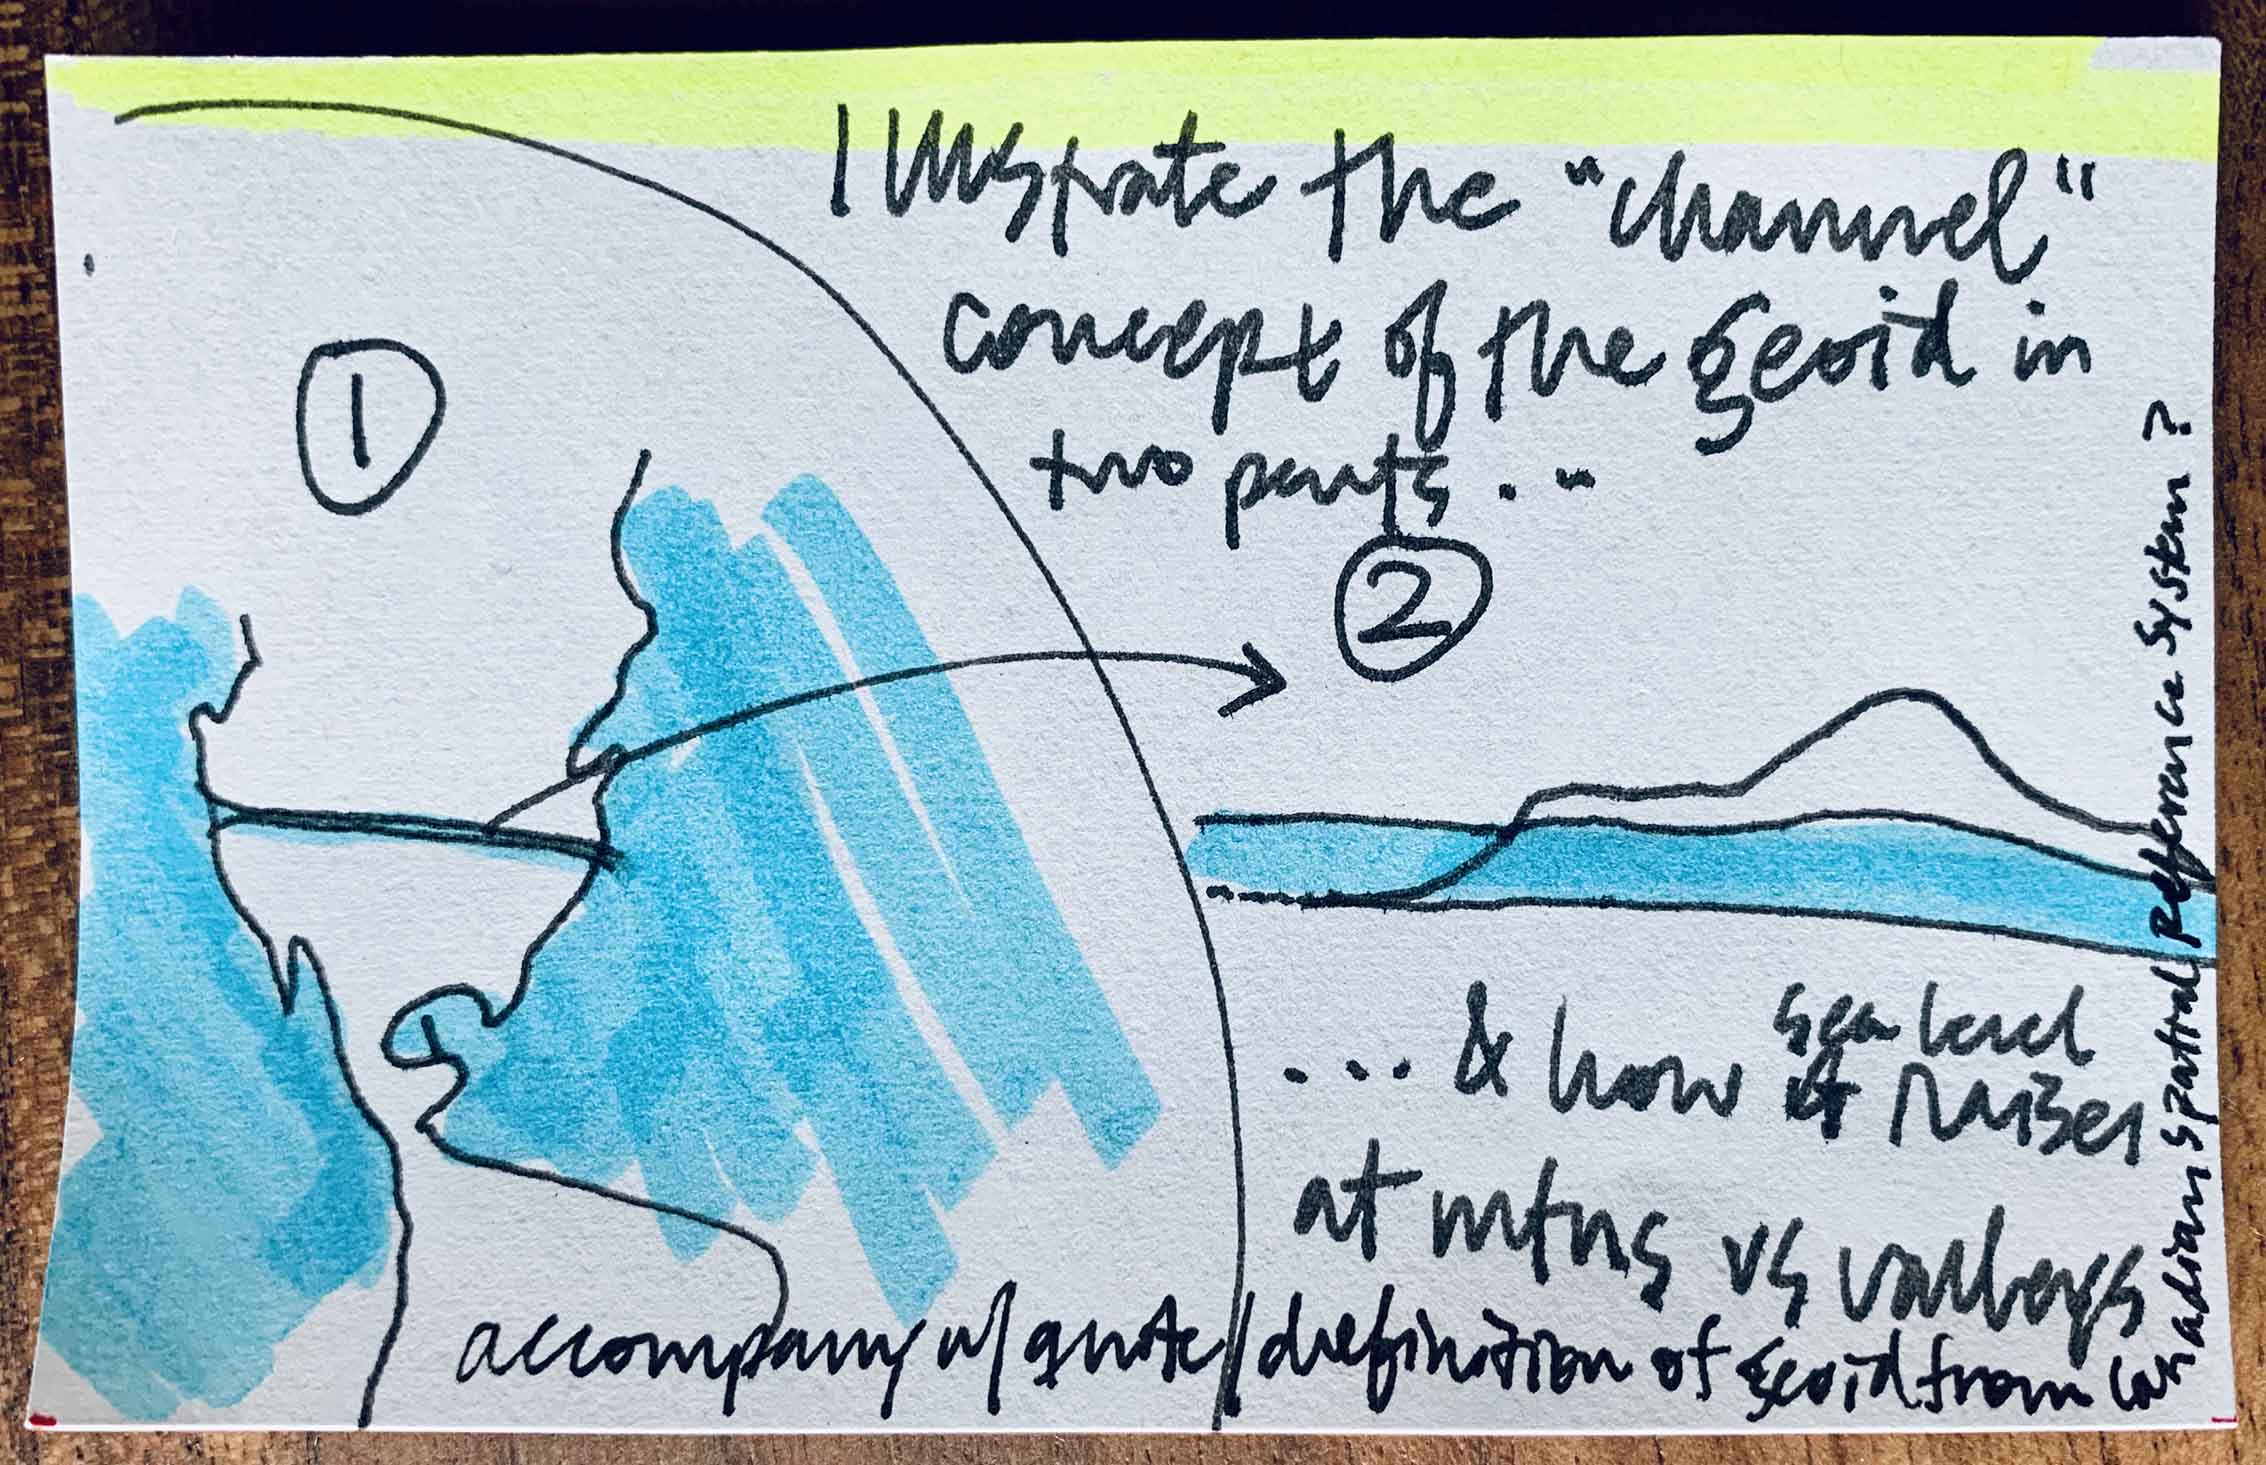
Across the time-averaged, temperature-normalized surface of the sea, the strength of gravity is exactly equal, and this lumpy, oceanic expanse equates to the actual reference used by surveyors to define elevations, known as the geoid. It extends across the continents too, though — oscillating through raised land masses and over empty valleys, forming a lumpy layer defined by a strength of gravity exactly equaling that at sea level. Scientists use an abundance of different technologies to measure micro-variations in gravity across the continents (a fascinating can of worms that I may pry open in a future post all its own). But another — far more analog — way to find the geoid at any land-based location would be to dig a channel from the ocean inland to that exact point, then wait to see where sea level settled.
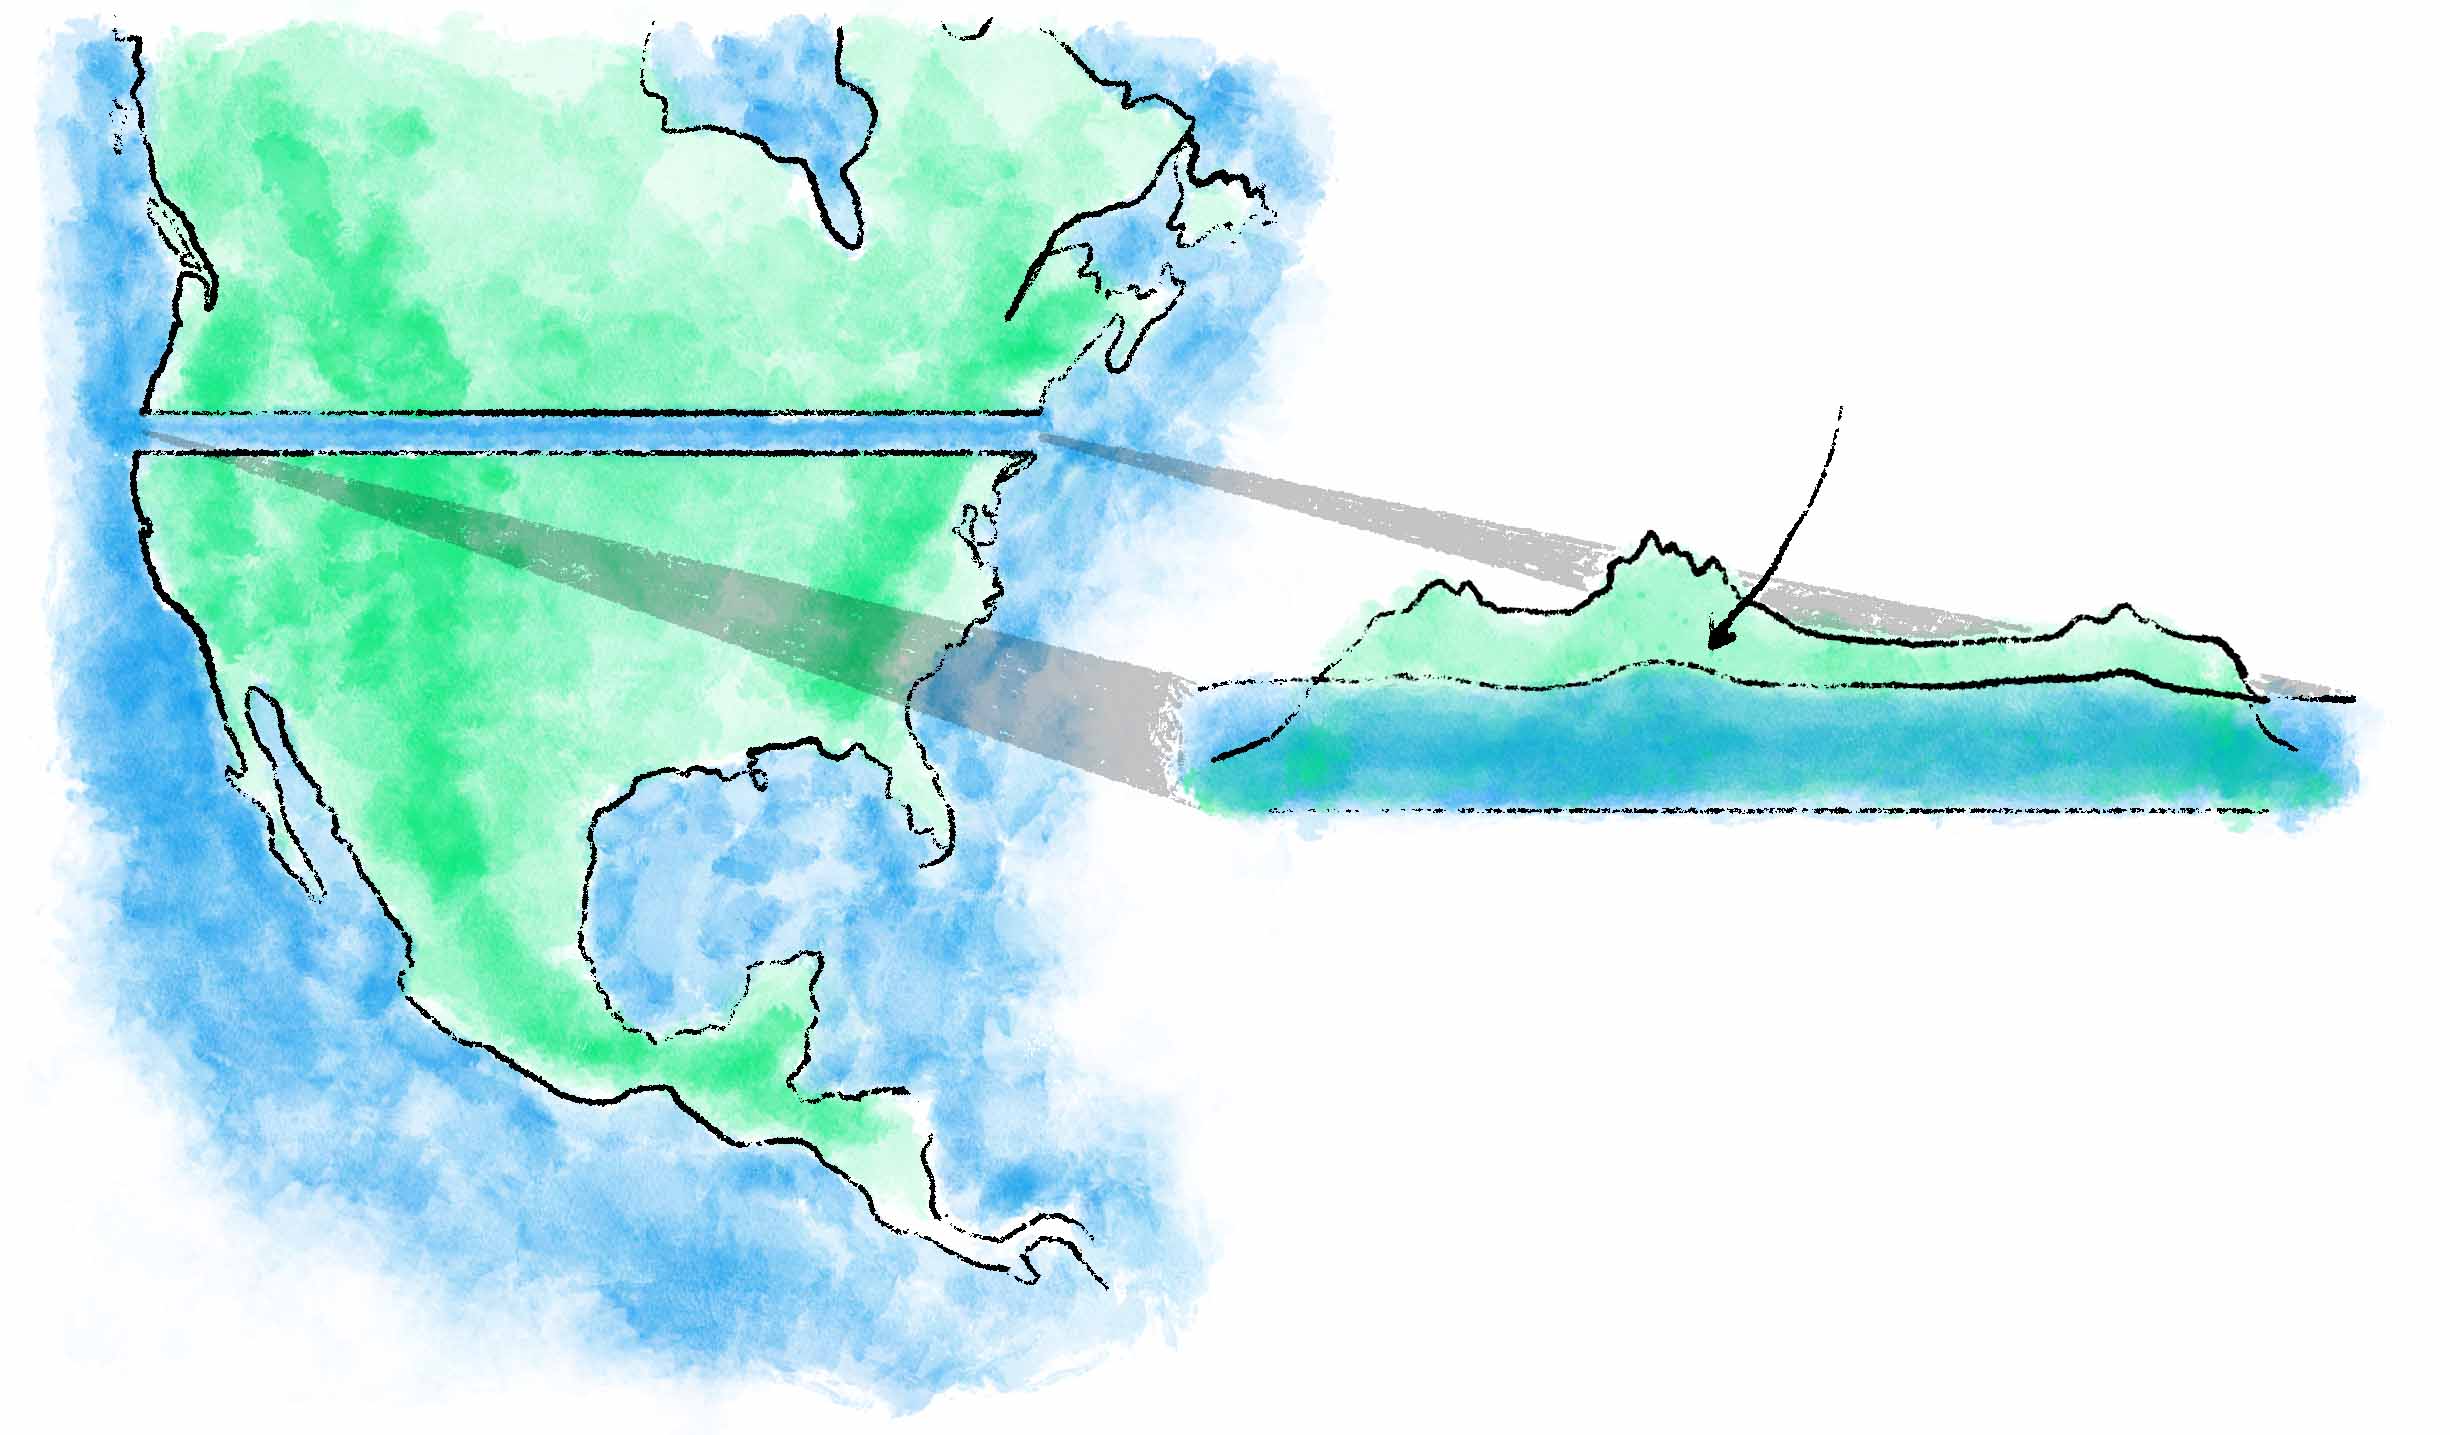
To determine the geoid’s height at any inland point, we could theoretically excavate a canal to the sea: the height of the water there will match that of the geoid, by definition. This extension of sea level will be pulled higher where it passes through taller and denser land masses, due to the increased gravity they create.
Given that the mass of a mountain makes its own gravity, how much taller would it be if it weren’t weighed down by this same self-induced gravity? That is, how would a mountain’s height change if we didn’t take into account the relative bulging of the geoid at its exact location?
The original geodesists seeking to measure Mount Everest as a part of British India’s Great Trigonometric Survey claimed that there were “grounds for inferring that sea-level under Mount Everest would be raised by 150 feet on account of the attraction of the mighty mass above it.” 7 Subtracting this alleged 150 feet would yield Everest’s ellipsoidal height, and is essentially based on the ellipsoid rather than the geoid. Put another way, we’d ignore the gravitational anomalies that the geoid accounts for, in favor of the visually flat surface provided by the reference ellipsoid — that smooth and mathematically perfect geometric form based solely on the discrepancies between Earth’s polar and equatorial diameters, and which disregards variations in density and landmass. The geoid and the ellipsoid intersect at geoid undulations: direct results of the non-homogeneous nature of Earth.
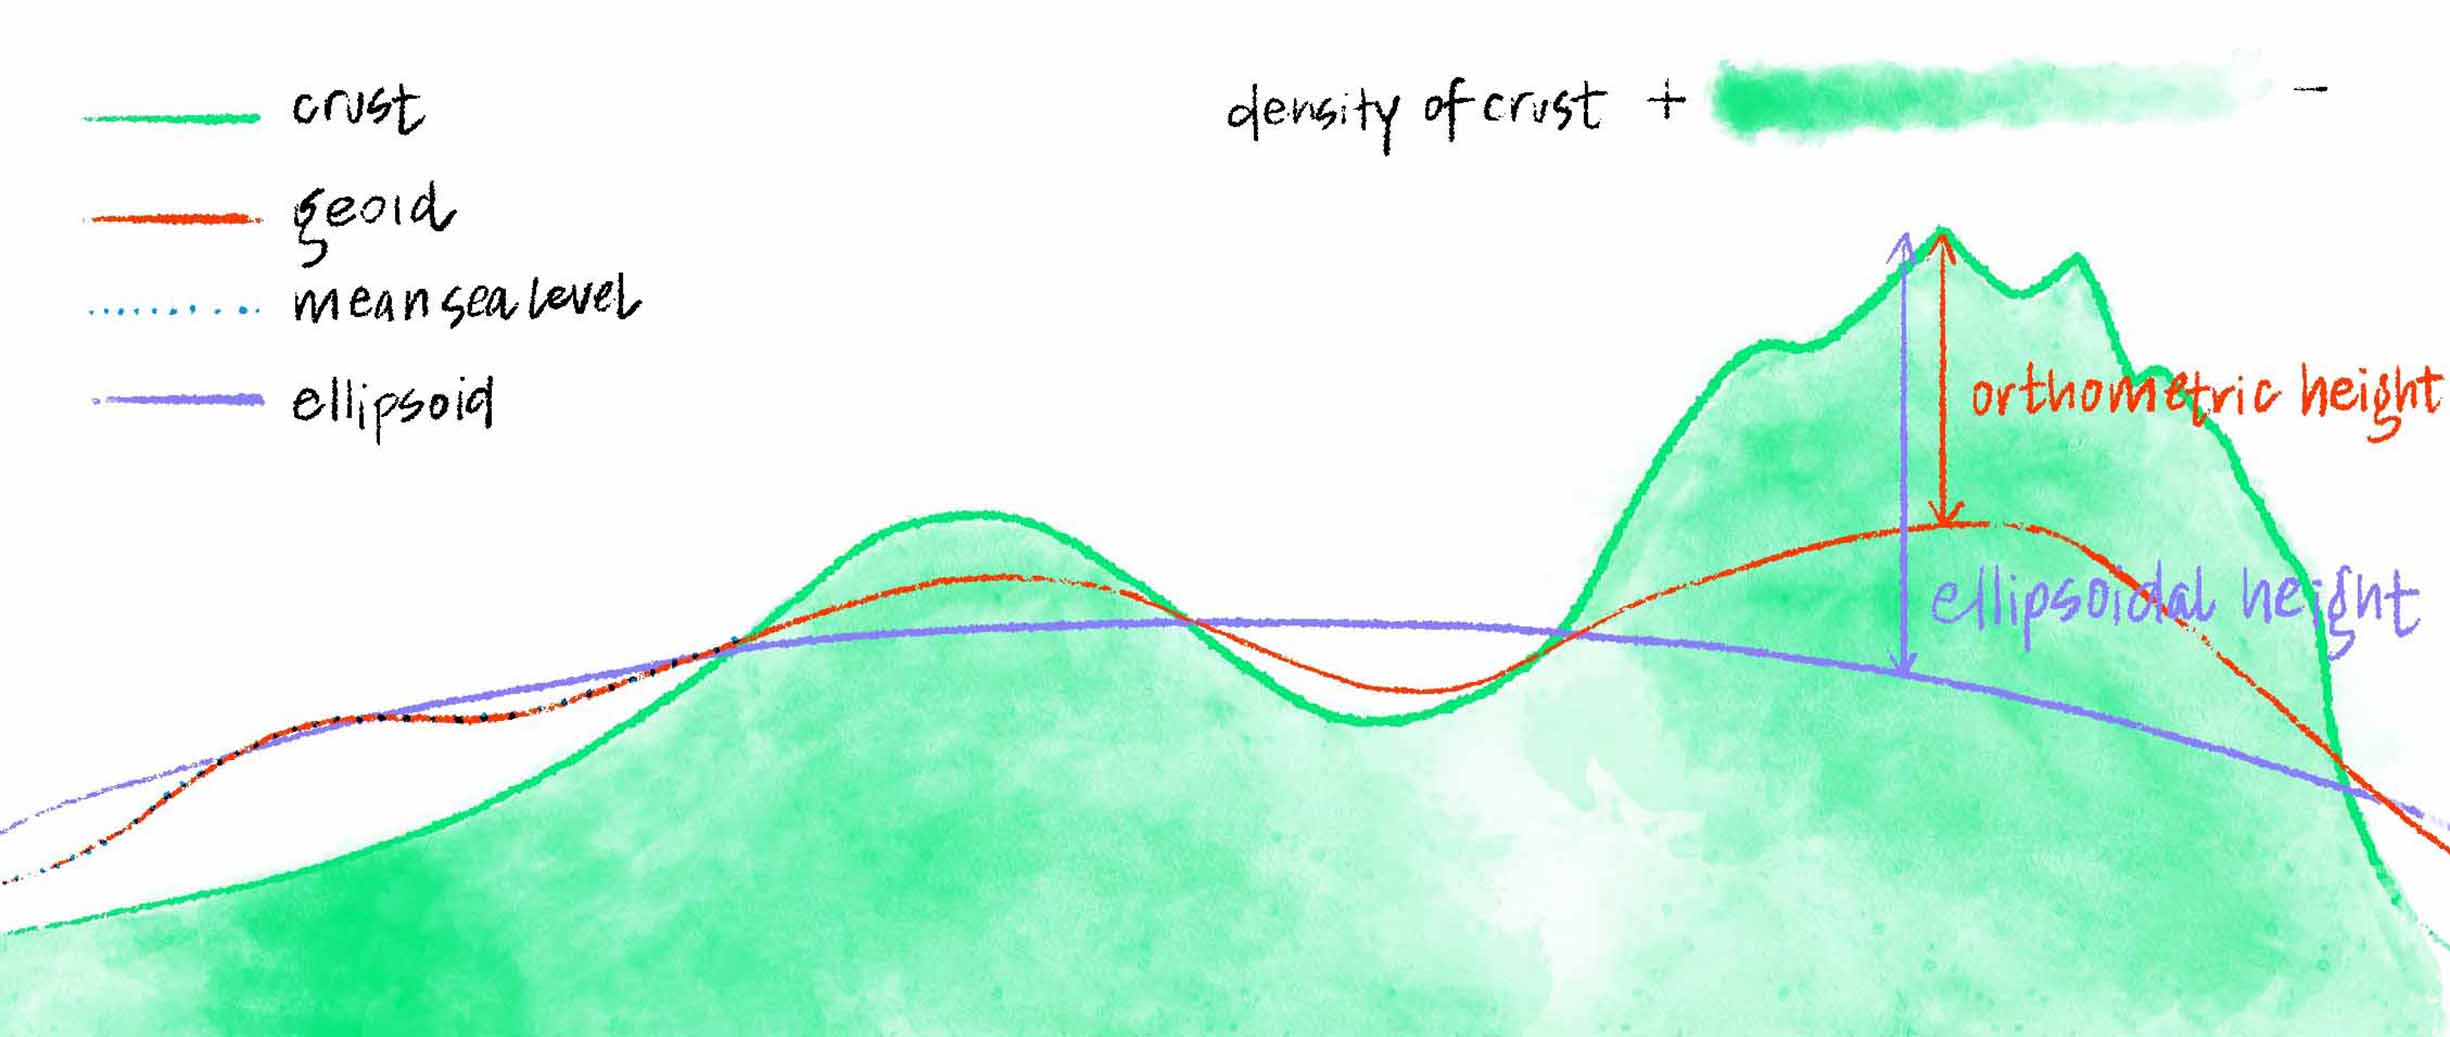
How much taller would a given mountain (or dense patch of crust) be without taking into account the gravity it creates (and therefore the hypothetical “sea level” it attracts)? We could instead measure from the ellipsoid (periwinkle line) — which essentially averages all Earth elevations to a perfectly smooth plane — to get an “ellipsoidal height”, rather than measuring from the geoid (red line), which gives us the commonly used “orthometric height”, often referred to as elevation above sea level.(Differences between the crust, geoid/mean sea level, and ellipsoid are very exaggerated in this diagram to make their relationships clearer.)
While the geoid is quite lumpy relative to the ellipsoid, it’s not as rugged as Earth’s actual crest- and canyon-riddled crust, because although gravity does vary in strength due to these landforms, their physical effects on gravity are not equal to their physical volumes. A mountain cannot produce the gravity required for a river to flow all the way uphill to its top; however, it might generate enough that water near it would settle at a relatively higher elevation than if that mountain weren’t there. The fact that the geoid takes these sorts of gravitational variations into account make it a far superior model for floodplain mapping and the like compared to the ellipsoid.
The geoid’s lumpiness is vastly exaggerated here, but serves to show areas of Earth where the pull of gravity is relatively stronger and weaker due primarily to the location, size, and density of landmasses.Image credit: NOAA.
Extraterrestrial elevations
Since scientists have identified a geopotential plane from which to measure height on our planet, it would seem at least theoretically possible that this same concept could be applied to other planetary bodies … and in fact, it has: this extraterrestrial equivalent of the geoid is called an areoid.
Other planets aren’t often enveloped in oceans the way Earth is, though, so how are areoids’ baselines chosen? And if they’re anywhere as arbitrary as the bases of the mountains they aim to quantify, what’s the point?
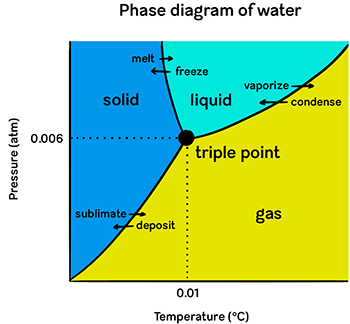
In the case of Mars’ areoid, its “zero” level had initially been based on atmospheric pressure: the minimum pressure at which water is stable, also known as its triple point . Anything lower than this and ice is capable of skipping its liquid phase and sublimating straight into gaseous form (the way dry ice does even at Earth’s normal surface pressure, since carbon dioxide — the molecule it’s composed of — has a much lower triple point of its own). The thought was that a hypothetical water-based Martian ocean — with a hypothetical sea level from which to measure elevations — could only exist at a pressure below water’s triple point. Otherwise, by definition, there would be no liquid to form imaginary oceans in the first place — just solid ice and water vapor.
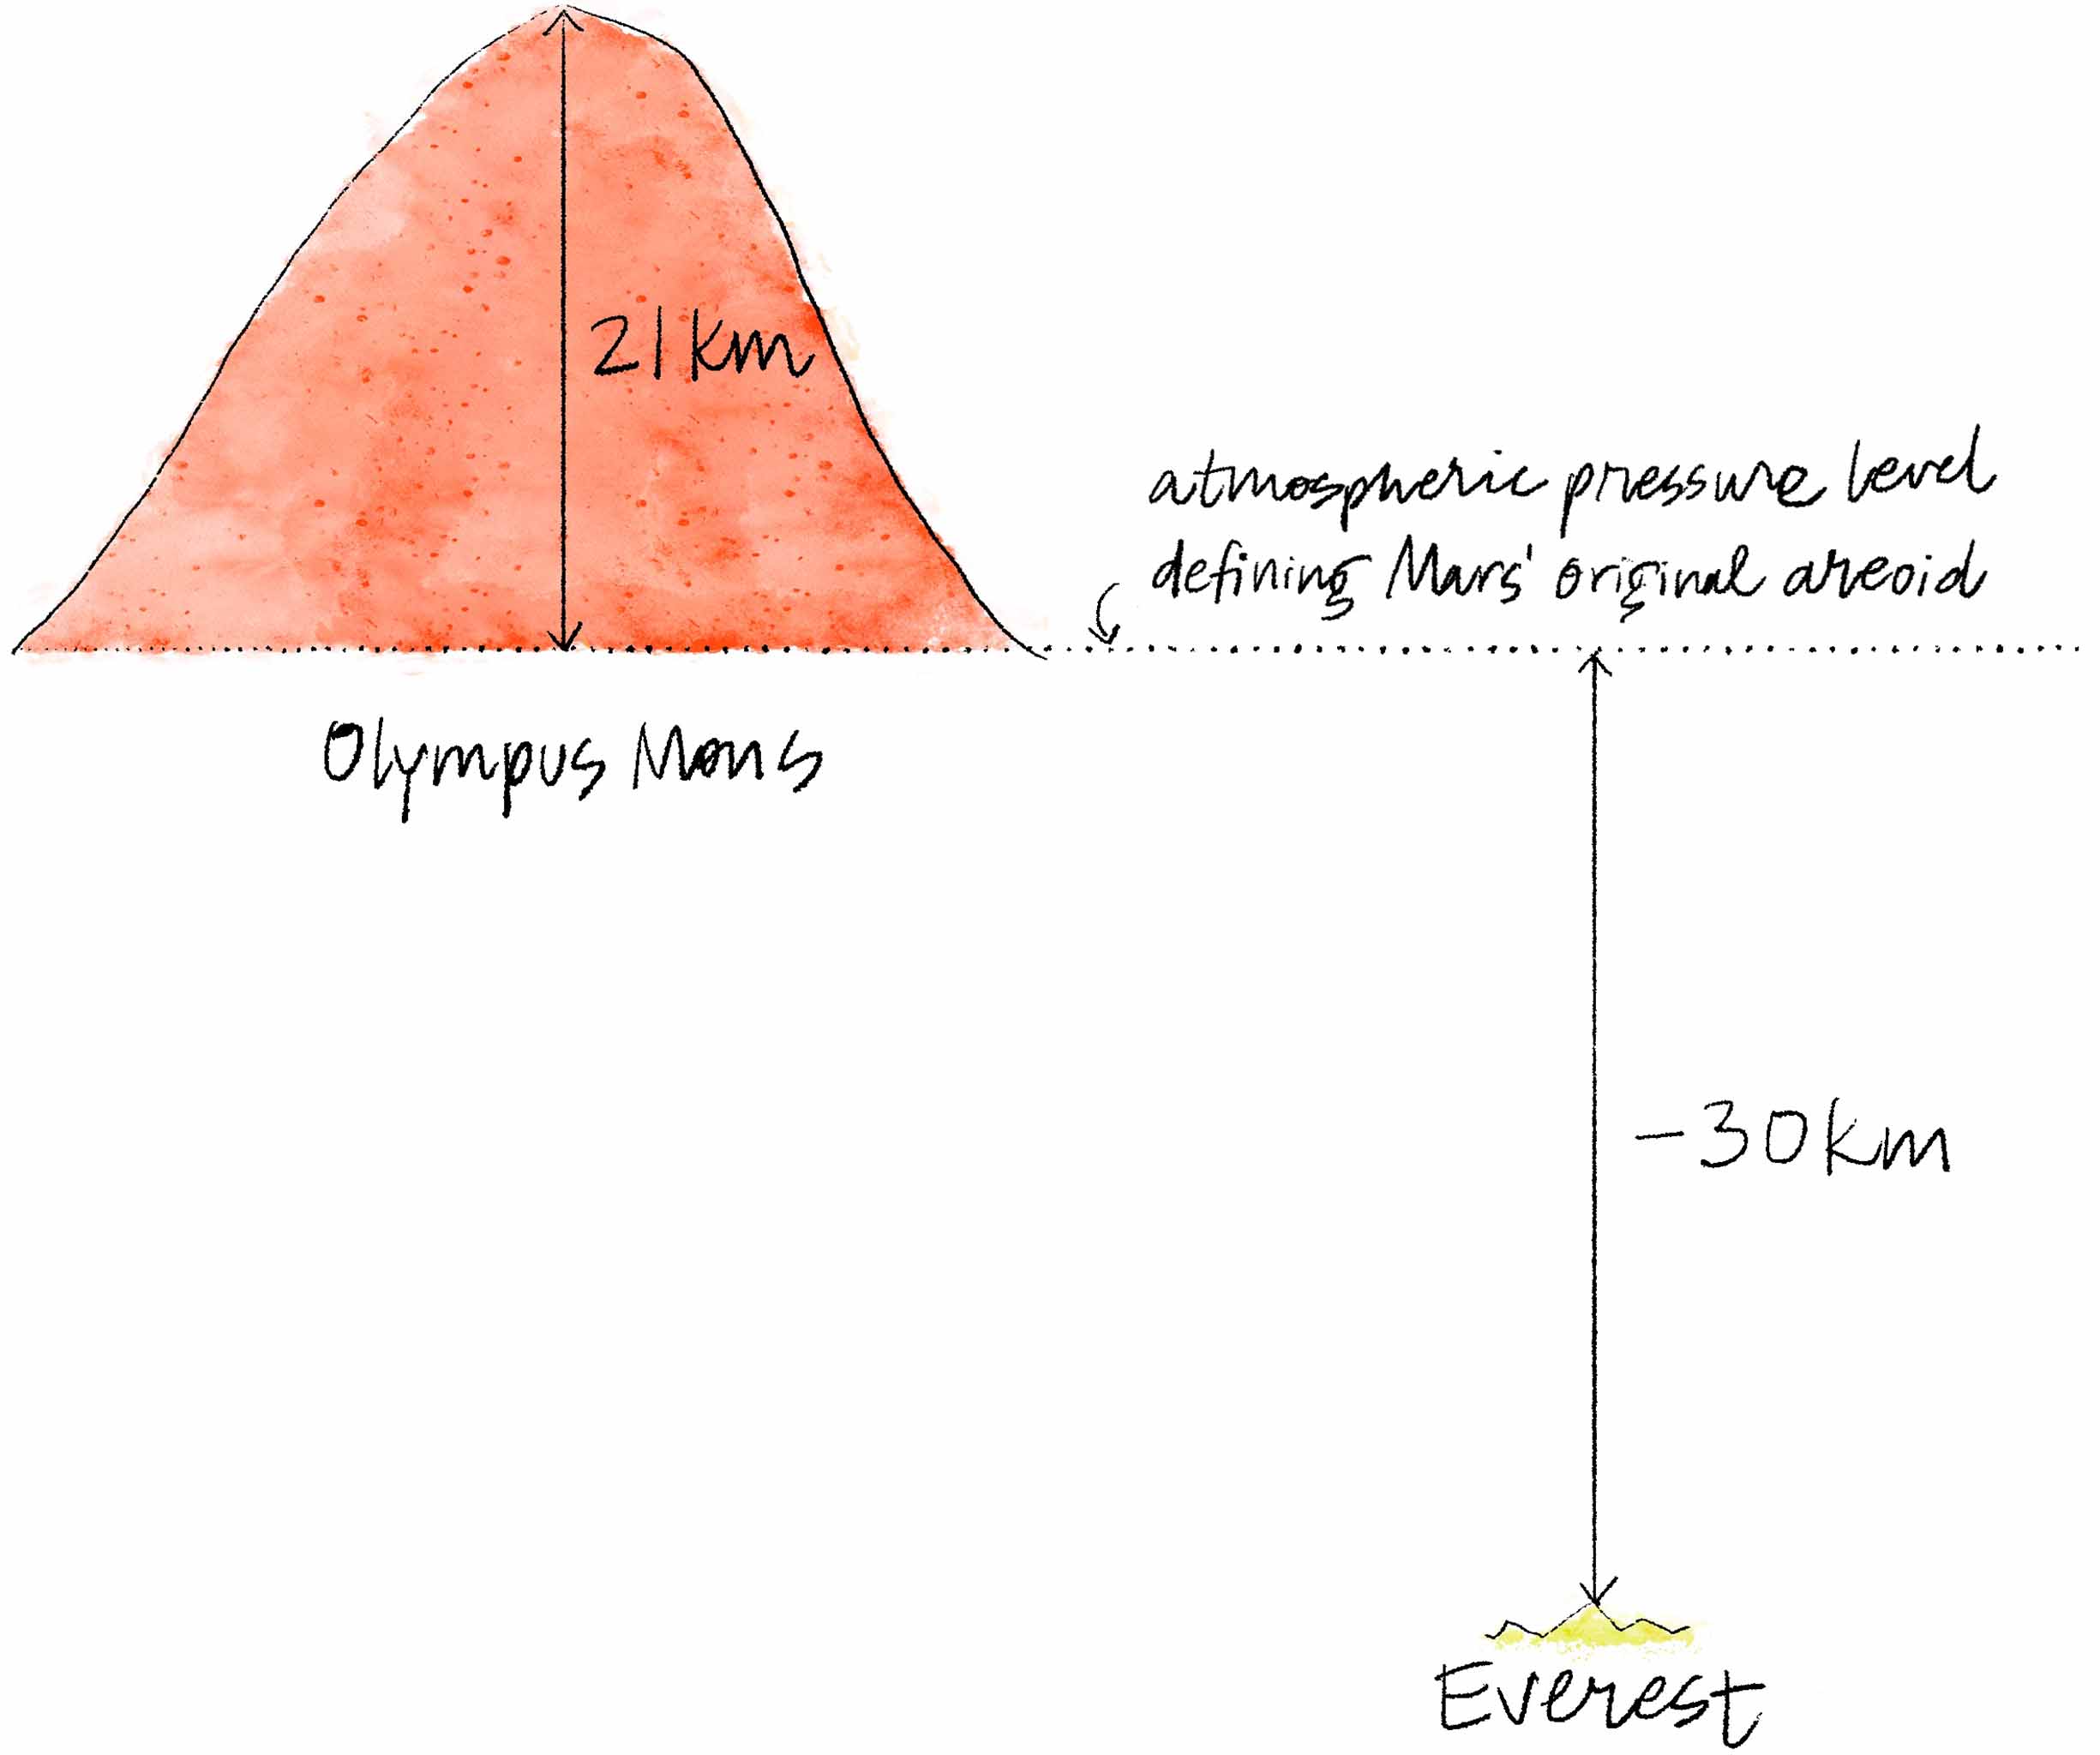
The original method used to establish the Martian areoid was based on atmospheric pressure. It put the baseline at the planet’s surface, notwithstanding higher landmasses like Olympus Mons, which rises about 21 kilometers (13 miles) above this pressure-defined baseline. If we were to use that same atmospheric threshold to measure elevations on Earth, even Everest — our highest point — would earn itself a negative measurement: about -30 kilometers (-18.6 miles). Given that Mars is sea level-less (and our own sea level is rather randomly based on the amount of water that happened to accumulate on Earth), the pressure-baseline approach affords a way to compare interplanetary elevations. However, those very comparisons come at the cost of seeming nonsensical.(Again, horizontal dimensions are nowhere near to scale; you can just assume they won’t be unless I say otherwise!)
The atmospheric pressure at sea level on Earth is just 0.6% of water’s triple point, however, so if we were to base our own geoid on that metric rather than sea level, it’d mean our geoid’s baseline would be high in the sky, no matter your Earth-bound location. Everest’s elevation would recalibrate to (very) approximately -30 kilometers (-18.6 miles) — that’s right, a negative elevation 8 — compared to its current elevation of 8,848 meters (29,029 feet). It’s clearly much easier for our surface-dwelling minds to make use of a sea-level-based reference point. All of this means that a triple-point-calculated Martian areoid and the elevations it results in aren’t particularly comparable to those on Earth, thereby rendering them far less relatable.
Sea level, sans seas
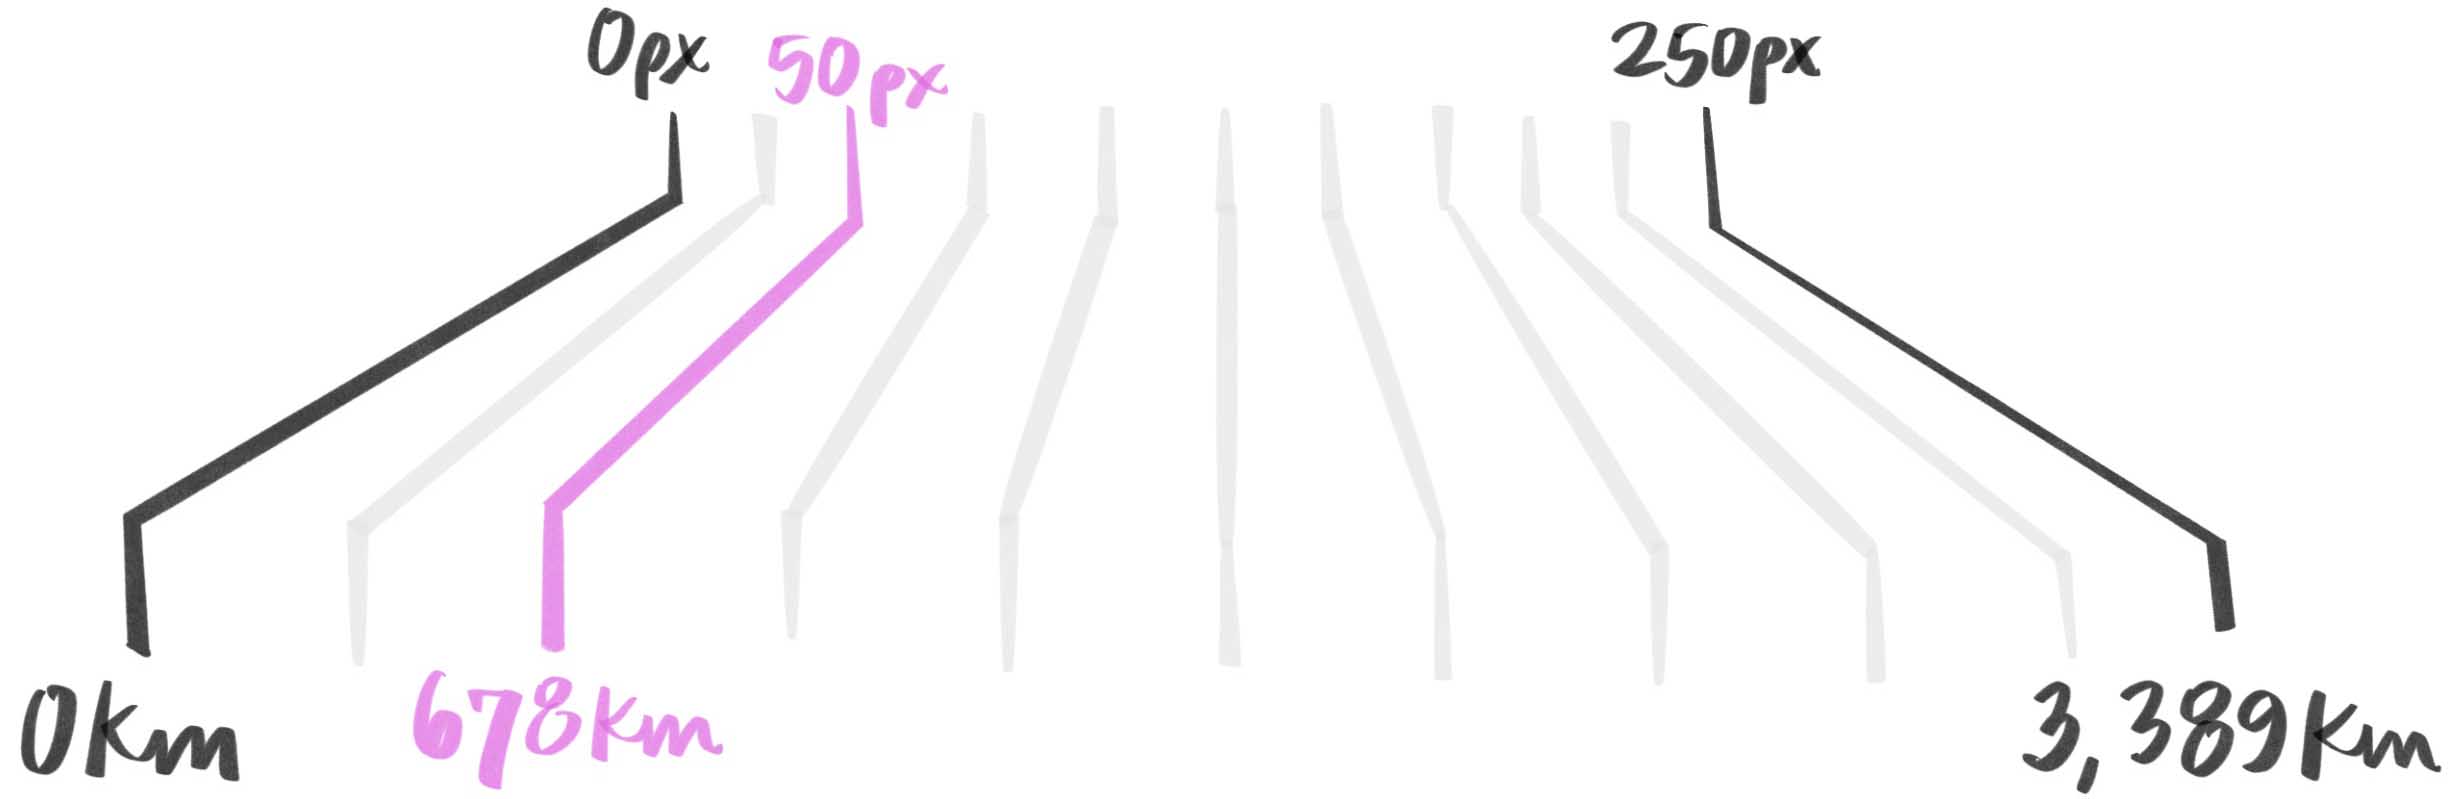
Fortunately for those of us in dire need of more fathomable (and accurate) Martian elevations, in 2001 the Mars Orbiter Laser Altimeter provided scientists with enough gravity information to reformulate Mars’ areoid. They now knew where the pull of gravity was relatively stronger and weaker, and could map the concentric gravity gradients that surround the planet like the layers of an onion — each ring its own geopotential surface exhibiting an exactly equal pull of gravity. Earth is circumscribed by its own geopotential surfaces, of which our geoid is one. For convenience and for comprehension, the baseline of the geoid was chosen to match that of the gravity potential at sea level, but it need not have been. It could have been set as a physically higher geopotential surface, but therefore with lower gravity potential.
The geopotential surfaces mapping equal strengths of gravity extend below and above any planet’s surface. Since these planes are the basis from which we measure elevations, it makes sense to choose one as a baseline that matches the surface’s circumference closely.(I exaggerated the gravity anomalies (that is, the squiggliness of the “onion rings”) here to visualize the fact that planes of equal gravity are bumpy in direct response to the planet’s uneven density.)
But on a Mars unmarred by el mar , how does one choose which onion ring to call “zero”? Scientists settled on the geopotential surface for which the mean radius matches that of Mars’ equator. 9 This doesn’t necessarily mean that every point along the Martian equator lies at zero inches in elevation, though: like on earth, a surface defined by equal gravity thereby responds to gravity directly, not to physical features (although it may be indirectly affected by land formations in so far as they in turn affect gravity to a degree), and will therefore vary in its distance from the crust, rising above ground in some places and falling below it in others.
Just like Earth’s geoid, Mars’ areoid also exhibits areas in which gravitational disruptions reflect topographical ones. Olympus Mons and the Tharsis region near it — home to some very voluminous volcanoes — produce the largest gravity anomalies in the entire Solar System. Olympus Mons came in at 22 kilometers (13.7 miles) high when measuring from the base of its bounding cliffs, but its summit is only about 21 kilometers (13 miles) above the Martian areoid. This is the inverse of what we saw with Everest, wherein its elevation is much greater than its base-to-peak height. Olympus Mons’ transposed elevation-to-height ratio actually serves to further emphasize its sheer magnitude: it produces its own gravity (with a lot of help from its neighboring Tharsis Montes and the magma-spawned plateau upon which they perch), thereby raising the areoid’s “onion ring” in its region and leading to elevation measures that are lower due to the areoid’s swell.
Most Earthly elevations are greater than the base-to-summit measurements of their mountains. On Mars, though, Olympus Mons is so massive that it pulls the planet’s areoid higher in its region, to the point that the difference between its peak and the areoid is about 1,000 meters (3,280 feet) less than the height of the mountain itself (from its natural base).
It seems sensible to develop areoids for planets and moons exhibiting elevated land formations, but scientists have even developed them for the gas giants, too. Like Mars’ initial areoid, those of Jupiter, Saturn, Uranus, and Neptune are based on pressure. Their baselines fall at the radial distance from their planet’s center of gravity wherein the atmospheric pressure equals 1 bar, which is just under the pressure at sea level on Earth. This threshold actually ends up falling right at the cloud levels that visibly define the “surface” for each of the gas giants.
Lower gravity and lack of tectonics lend a leg up
Although areoids provide a helpful way to compare elevations across planets, they fail to account for the fact that bodies with lower mass exhibit lower gravity: namely, the pull that Martian mountains contend with is just 38% the strength of Earth’s, making it much easier for them to sprout skyward. To literally level the playing field, I normalized for Earth’s gravity (in an overly simplistic, possibly precarious way), and found that beneath its strain, Olympus Mons only makes it to the 8.4 kilometer (5.2 mile) mark when measuring from its base to its summit (compared to 22 kilometers (13.7 miles) under its own planet’s gravity), falling just short of Mauna Kea’s 9.2 kilometers (5.7 miles).

Assuming there’s a more or less linear relationship between a volcano’s height and the gravity exerted upon it, an earth-bound Olympus Mons might have only ever grown to about 8.4 kilometers from base-to-summit.(Finally a sketch that is more or less to scale! Although I did have to do some experiments and estimations (silly putty was involved) to get an approximation of Olympus Mons’ would-be diameter on Earth, assuming its volume stayed the same…)
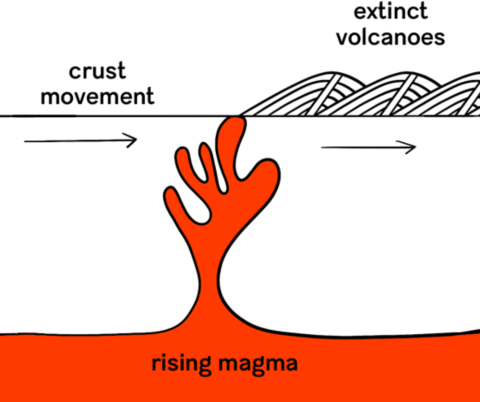
Mars’ relatively low gravity isn’t the only pinnacle-producing trick the planet has up its proverbial sleeve, though: lack of tectonic motion plays a prominent role in the heights that its mountains have managed to reach. Most of the Martian shield volcanoes are significantly more massive than any on Earth, in part because their crustal locations stay statically positioned above the hotspots from which the peaks originate. Meanwhile, the land above Earth’s hotspots are never in the same spot for long (geologically speaking), due to our planet’s plate movements. This explains why the Hawai’ian hotspot led to a chain-like formation of several sea mounts, rather than a single skyscraping summit in the middle of the Pacific.
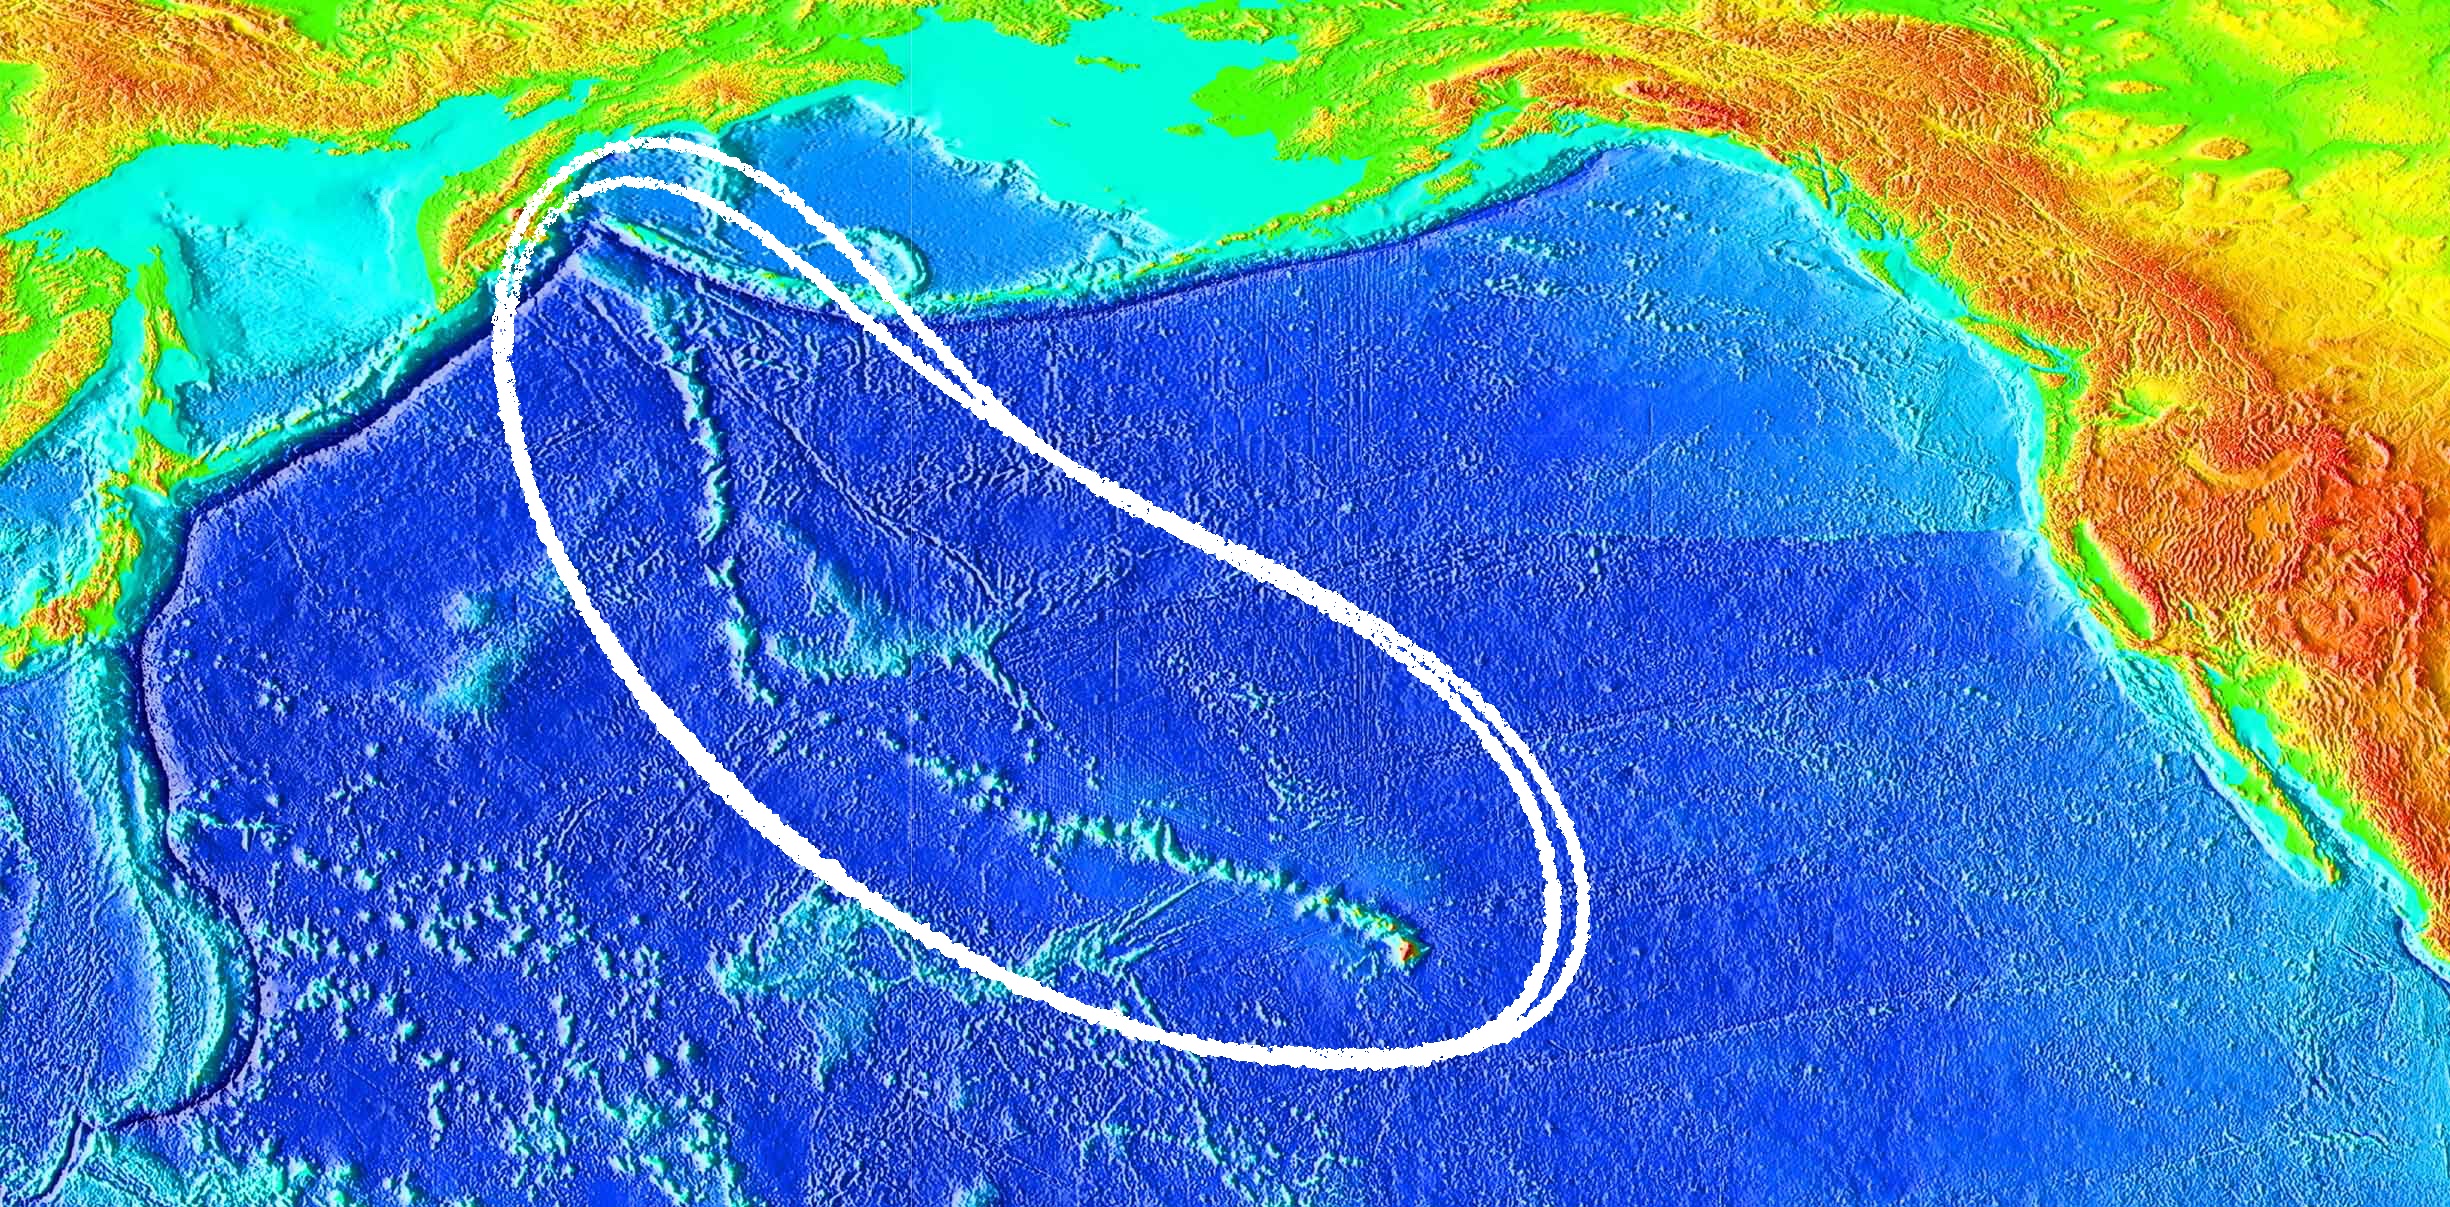
The Hawai’ian hotspot has stayed stuck in place, while the Pacific plate moved in a northwesterly direction, evidenced by the trail of islands and seamounts scattered from Hawai’i’s Big Island to the hotspot's first creations, now near the Kamchatka Peninsula in Russia.Image credit: NOAA.
This made me wonder about the Hawai’ian hotspot’s lava-output potential relative to that of Olympus Mons’: if the Pacific plate had stayed still, how vast a volcano could it have produced? To get a rough idea, I simply used the collective volume of the Hawai’ian chain of islands and seamounts — nearly 750,000 cubic kilometers (180,000 cubic miles) — as a proxy for Mauna Kea’s would-be size on a hypothetical, tectonic-less Earth … I say “simply” on my part, because someone else had already written an article about the hotspot’s total output. And equally fortunate for me and my free time, NASA had already done the legwork to determine Olympus Mons’ volume at 3,862,000 cubic kilometers (just under 2,400,000 cubic miles). From there, it was just a matter of division to discover that over five Hawai’ian-hotspot-outputs-worth of lava would fit inside of Olympus Mons!
Of course, as far as the mountains of the world — that is, the Solar System, if not the universe — are concerned, this is all just semantics. And I think that’s more or less where I’ve landed as well. The behemoths of the land (and sea, and space) are wild things, unbridled by our attempts to bestow metrics and accolades upon them. A mountain’s human-assigned height will always carry with it a whiff of the arbitrary, but from now on when I read an elevation on a map, I’ll understand all that went into it.

Process

Here’s where I explain a bit about the intense nerdiness that goes on behind the scenes while I'm preparing a post.
This being my debut blog post, the selection of topic seemed especially important. I wanted readers to relate to the main question I aimed to answer. Ideally it’d be something they’d (you’d) found themselves wondering about before, but I also wanted the explanation to uncover, and answer, even more intriguing questions (that’s usually what happens when you start digging into a question anyhow). I had no shortage of options to choose from, but ultimately ended up researching how mountain heights are determined.
This initial question over-delivered in terms of providing directions to dive into even deeper. I created homemade index cards (a.k.a. chopped up scrap paper) to document each snippet of interesting information, and promptly found myself overwhelmed trying to arrange them into a linear story. Ultimately and agonizingly, I had to sacrifice some captivating trigonometry-driven side plots (I will be back for you yet, SOHCAHTOA!) to maintain a more cohesive thread.
-

Well-behaved factoids, cooperating temporarily as I attempt to determine a storytelling sequence. -

Factoids rebelling against being forced into orderly rows and columns! -
An early illustration idea that ended up making it into the final post. -
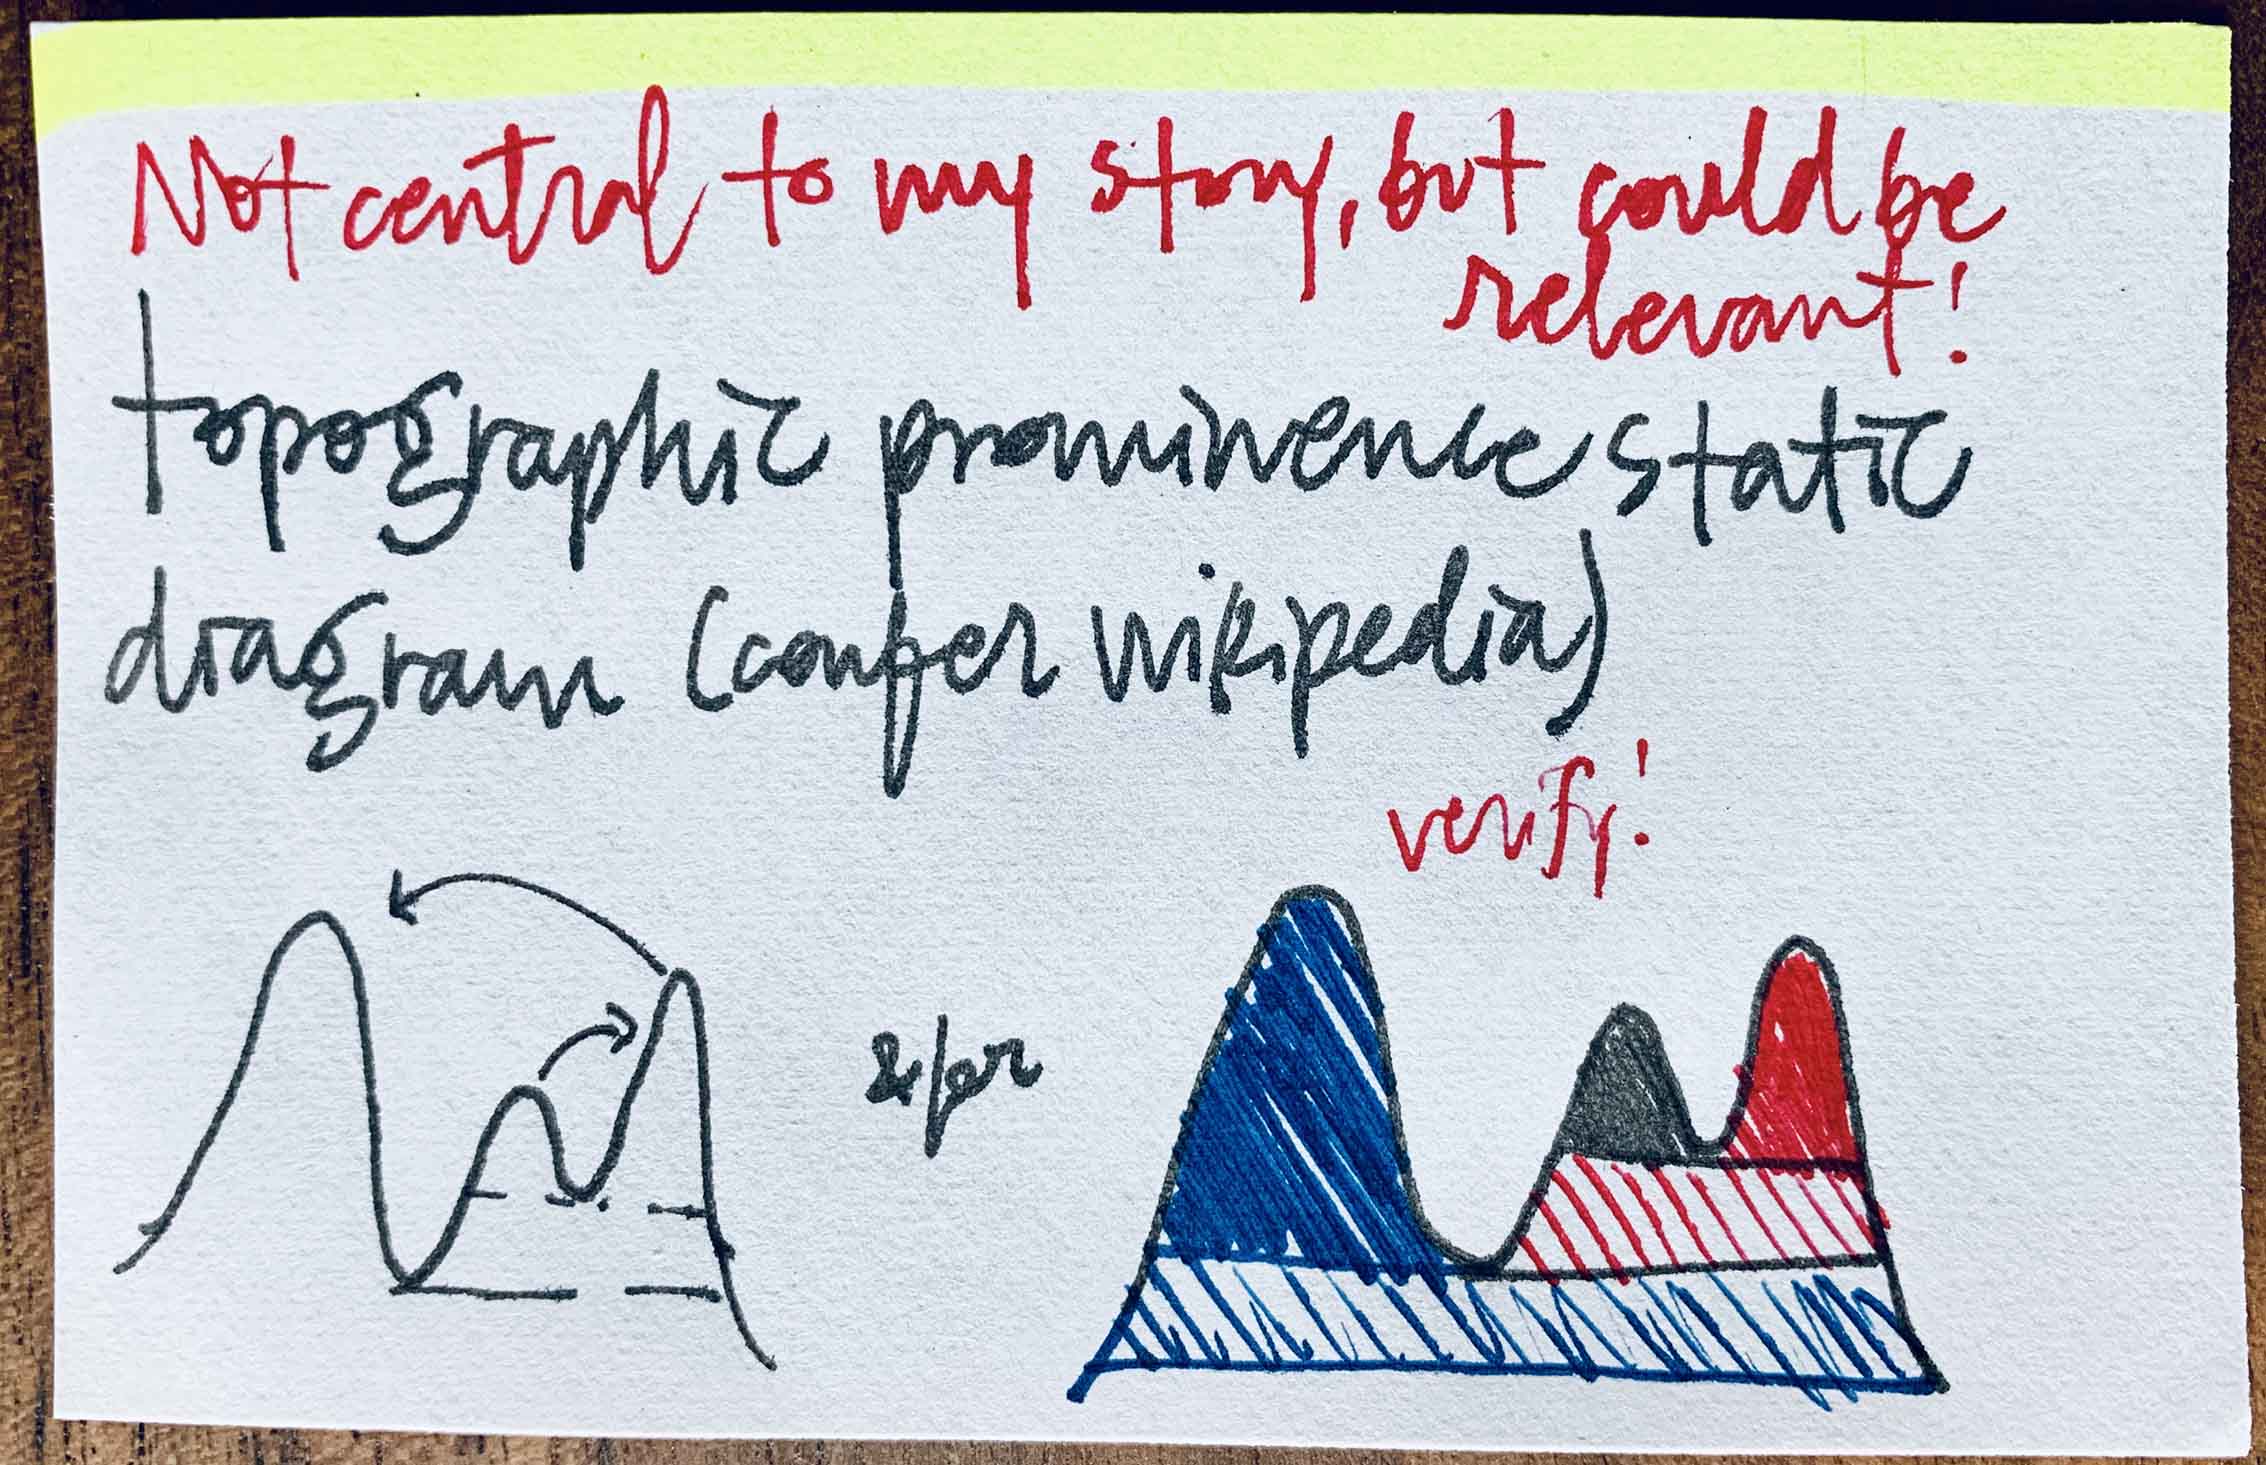
This little factoid didn’t quite make the final cut, but I wish it could have … there just may be a future post featuring topographic prominence.
I decided to use my iPad and the drawing app Procreate to create explanatory illustrations. I hadn’t used Procreate before, so this was a “good learning opportunity”, by which I mean an acceptable excuse to spend an entire weekend making a single, very awkward, not-quite scientifically accurate 5-second animation.
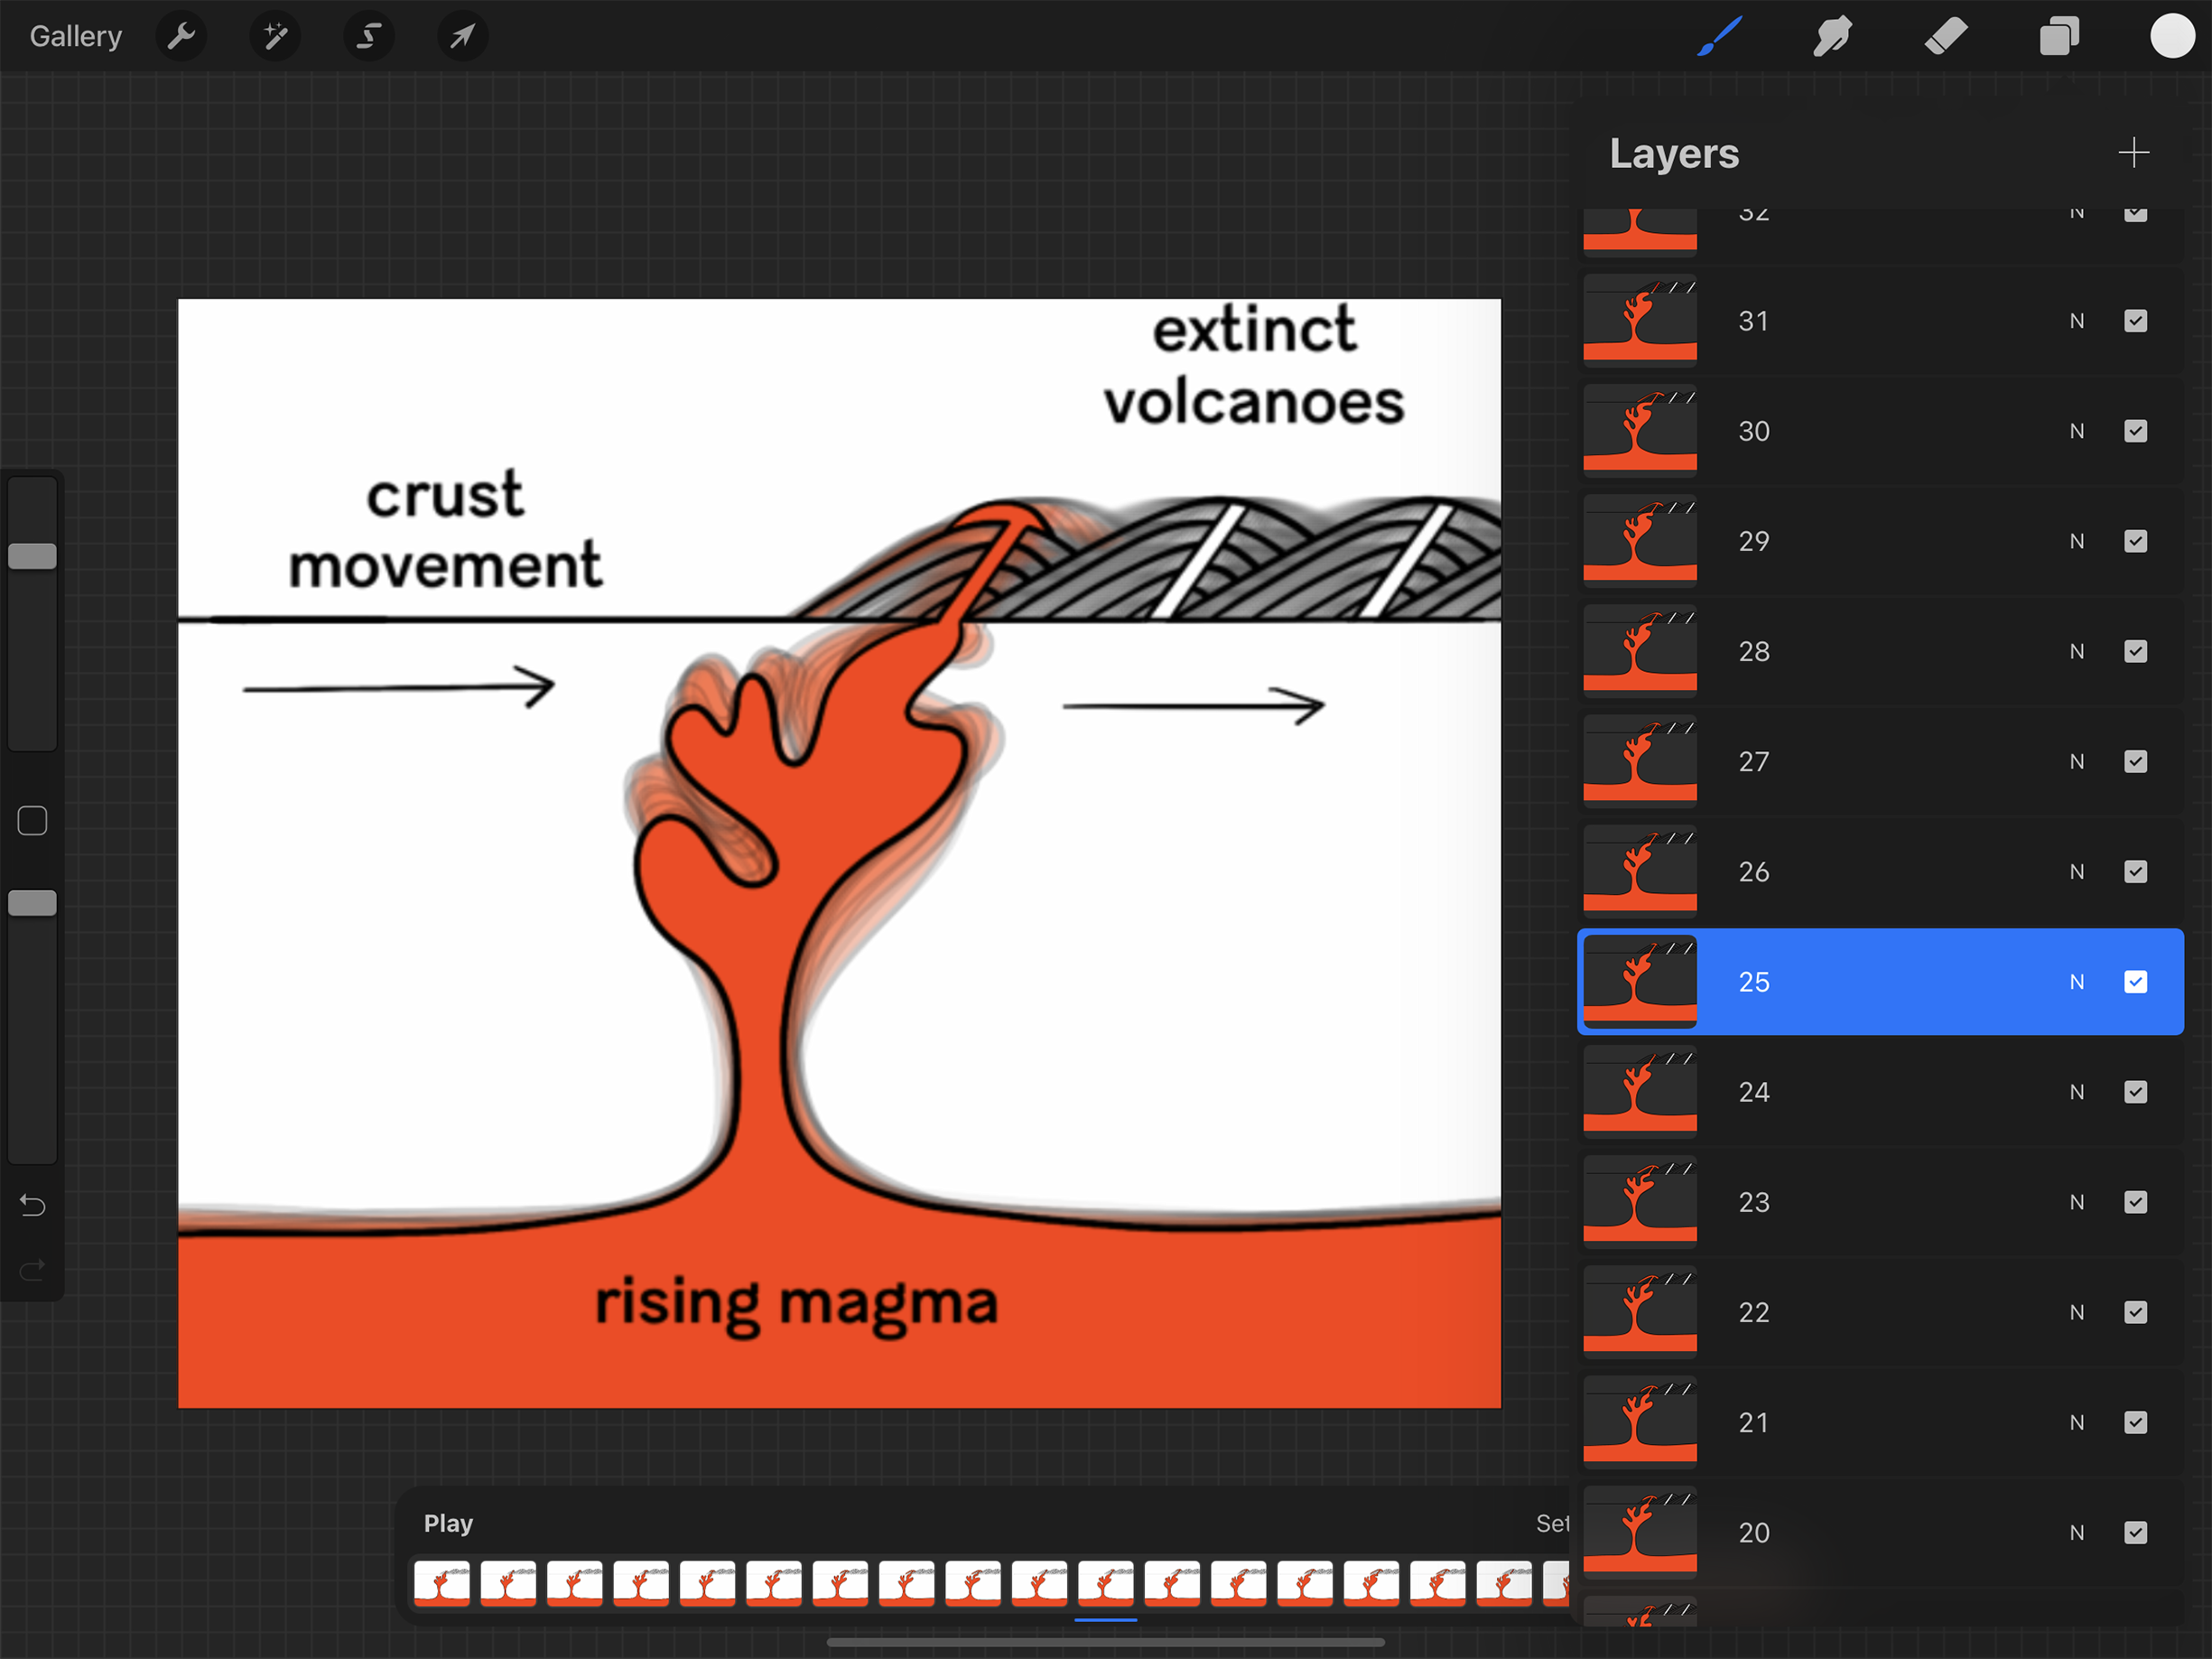
Please note: hotspots in all likelihood do not actually resemble the ketchup-bottle-wielding amoebas I inadvertently made them out to be.
Yet another good learning opportunity presented itself when I made it my goal to master D3.js, a JavaScript library for coding data visualizations, which I used to build the visualization of Mars’ areoid wherein you can drag to change its radius. To be honest, I think this interactive diagram is slightly gratuitous in that it isn’t really necessary to get the point across: its preceding illustration and text probably do a better job of that conceptually. But I really wanted a tiny self-imposed D3 practice project, plus I think it’s just fun to drag the areoid-circle and see how far it is from Mars’ core.
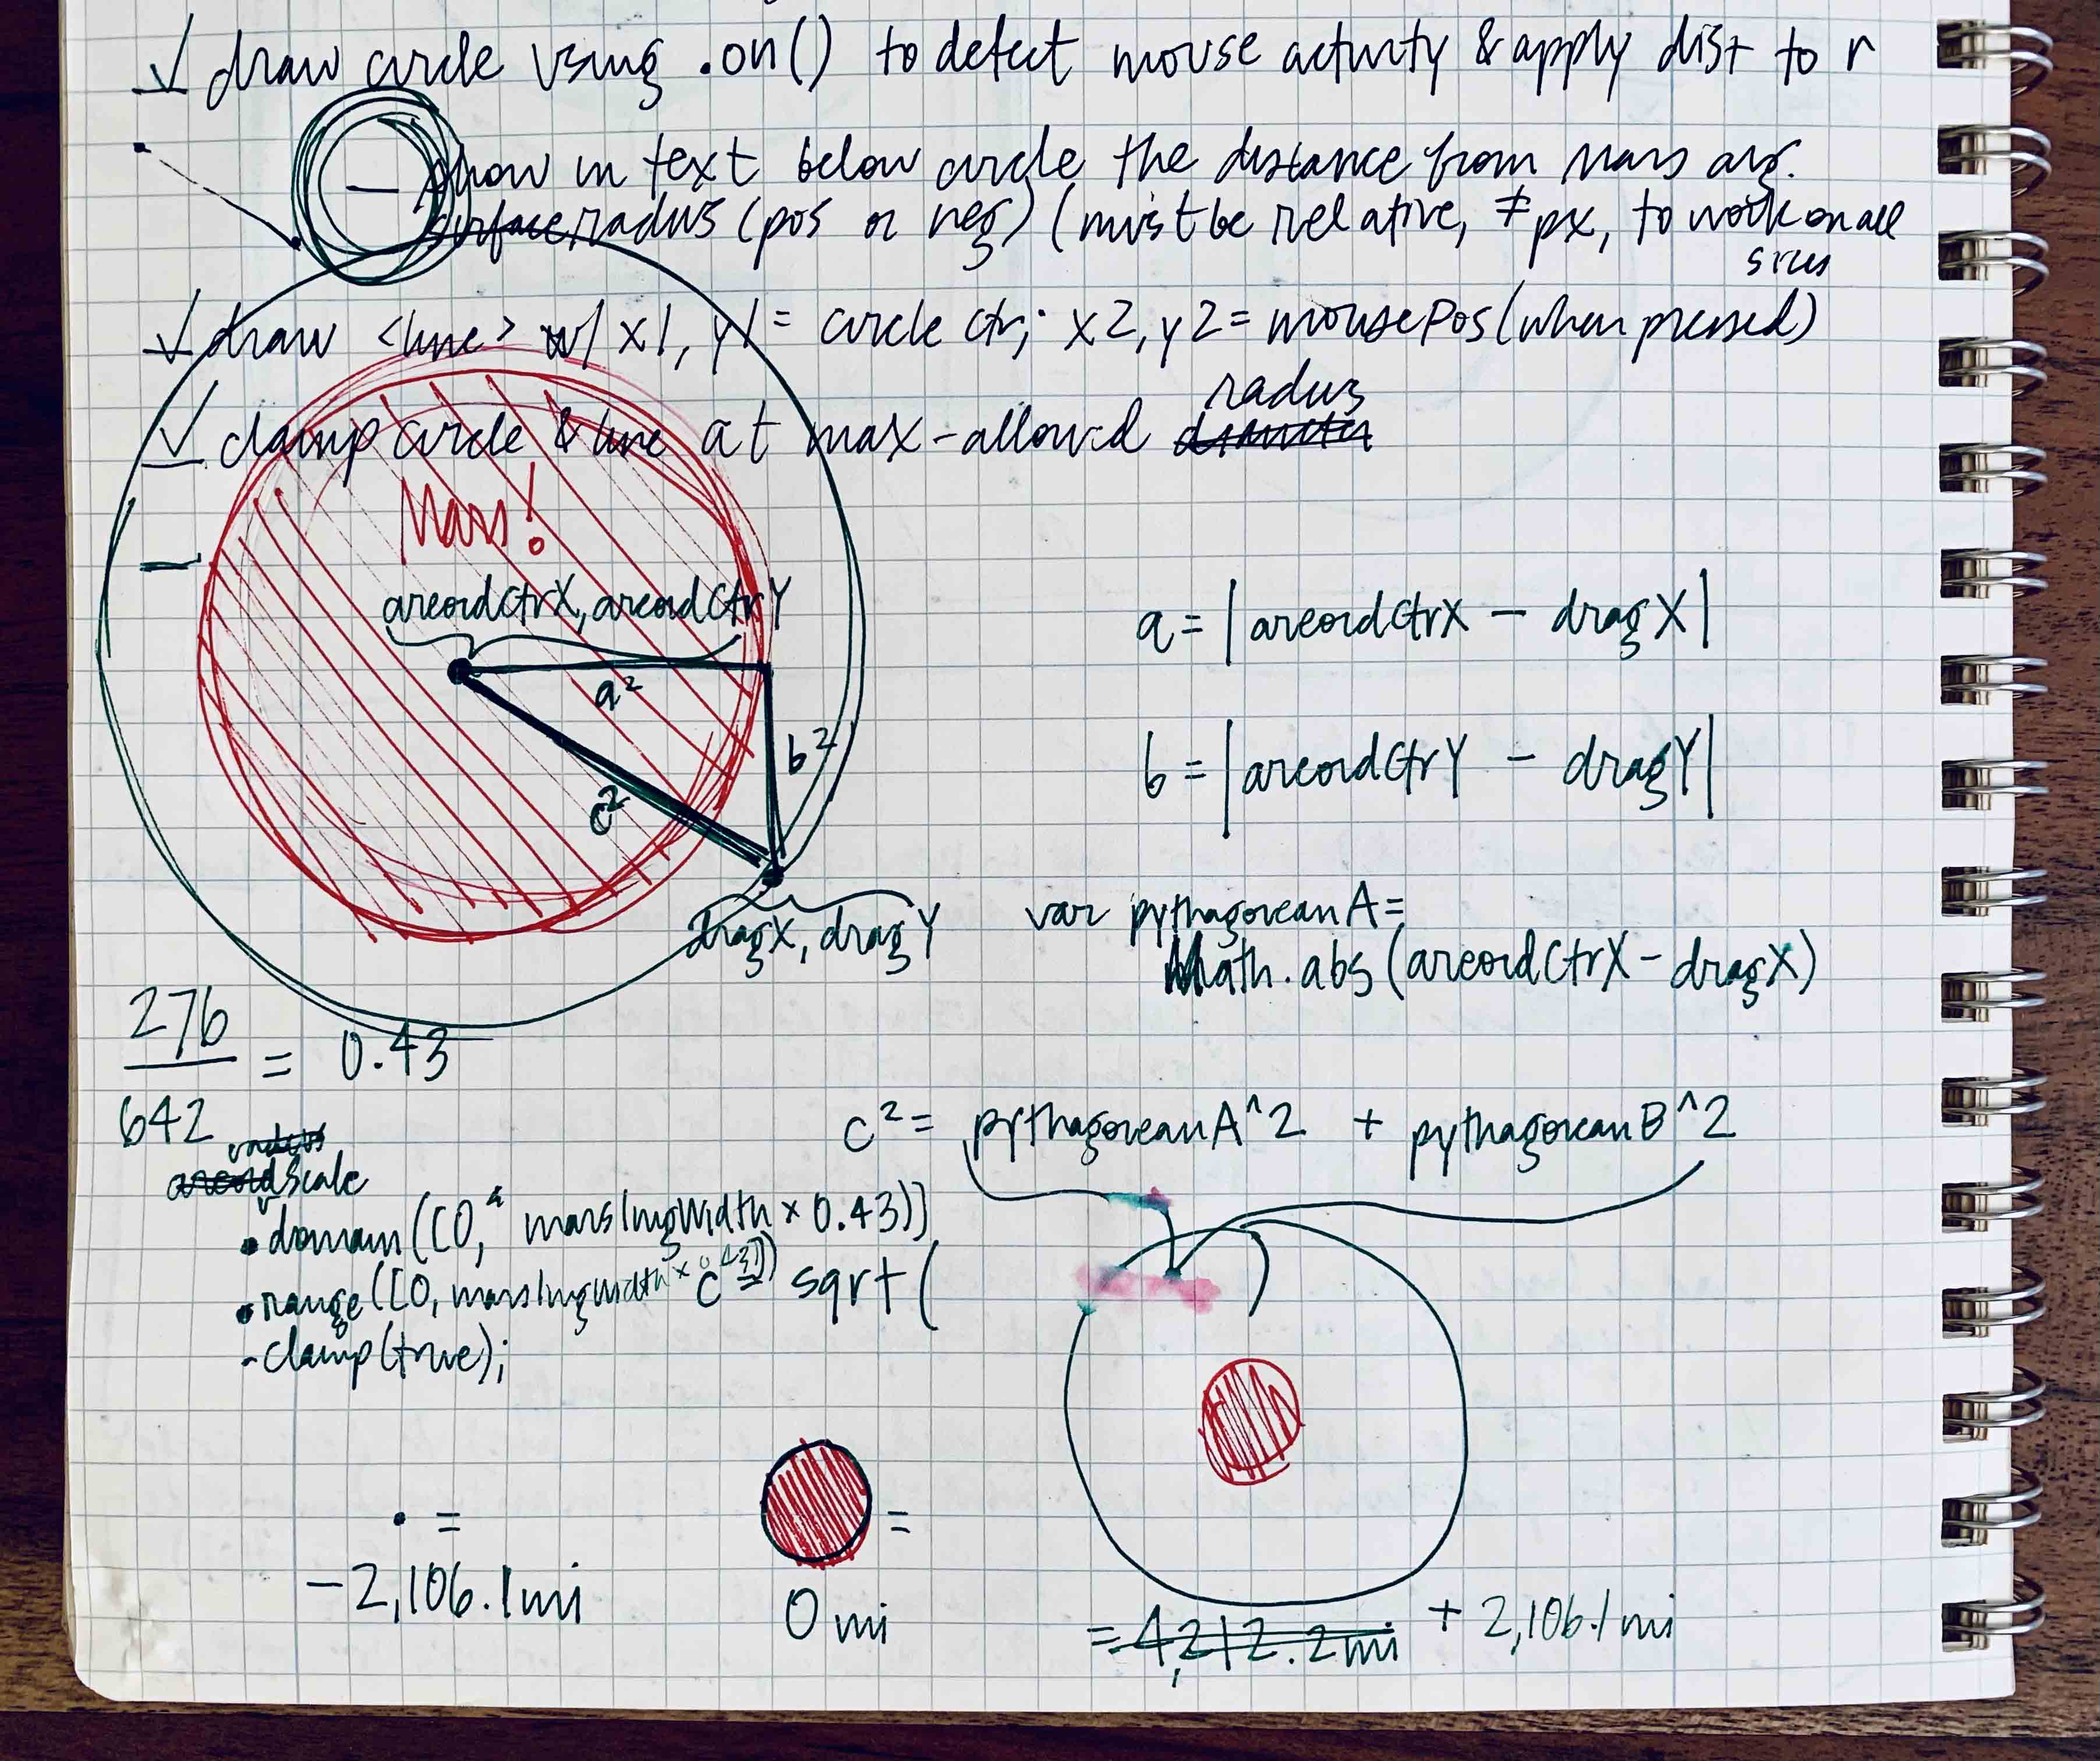
There’s nothing a little graph paper can’t solve.
The areoid visualization’s draggability ended up hinging upon my recollection of the Pythagorean theorem (not quite trigonometry, but it does fall into the category of triangular geometry, so it’s close), for which I awarded myself bonus nerd points. 🤓 🤓 🤓 To draw an SVG circle with D3, you need to set a radius. In this case, the circle’s radius changes as the user drags the circle smaller or larger, so I needed a way to capture the distance of the user’s mouse (or finger, if on a touchscreen device) from the areoid-circle’s center.
- I knew the pixel coordinates of the circle’s origin because I’d set them myself to position it, and I could use JavaScript to capture the location of the user’s mouse as they dragged.
- From there I reasoned (with much reliance on my favorite graph-paper-filled notebook) that I’d effectively have the two legs of a right triangle: I could subtract the x-coordinate of the mouse from the x-coordinate of the circle’s center and repeat with the y-coordinates.
- But what I needed was the hypotenuse … enter Pythagoras with his theorem of a2 + b2 = c2 in tow. I squared the absolute values of the mouse’s and origin’s x- and y-coordinates’ differences, respectively (a2 and b2: the leg-lengths of the right triangle).
- Next I passed their sum to the adorably abridged JavaScript function Math.sqrt() (short for square root, and yet somehow I am always left nostalgic for the squirt gun fights of my youth when I use this function), to ultimately solve for c, alias hypotenuse, alias radius…
- … alias distance from Mars’ center, which I calculated via D3’s scaleLinear() function and surfaced in text form below the visual.


Fun fact (or bug, depending on how you look at it): if you drag very quickly, the straight line representing the radius won’t quite extend all the way to the circle’s edge by the time you pick up your mouse. This is because of all the math involved in calculating that little line’s length: your computer can’t quite keep up!
Glossary
- centrifugal force / sen-trif-uh-guhl fohrs /
-
A force apparent when viewing a rotating frame of reference, which acts outwardly on objects moving around a center. Definition is my own, informed by Oxford Languages and Wikipedia.
-
el mar

-
Spanish for the sea.
-
escarpment
/ ih-skahrp-muh nt /
-
A steep slope or cliff face forming the boundary between two fairly level areas, often caused by erosion and/or faulting. Also called a scarp. Definition is my own, informed by Wikipedia.
- fold mountain
-
A crest, usually within a range, formed by tectonic plates pushing against each other, which results in the rising and wrinkling of Earth’s crust where they meet. Definition is my own, informed by National Geographic.
- geopotential / jee-oh-puh-ten-shuh l /
-
The amount of work that must be done against the Earth’s gravitational field in order to raise a mass from sea level to that point. A field of points where that amount of work is the same forms a geopotential plane. Definition is my own, informed by University of North Carolina Asheville’s Atmospheric Sciences Department.
- hotspot
-
A location on Earth’s crust above magma that is extra-hot relative to the surrounding magma, due to thermal plumes arising from even deeper within the earth. This causes the crust to melt and weaken, resulting in volcanic activity. Definition is my own, informed by National Geographic and Incorporated Research Institutions for Seismology.
- mantle
-
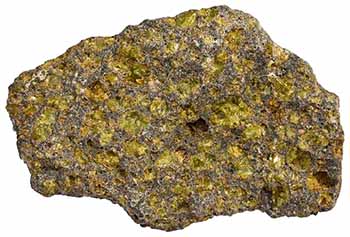
The region of a planetary body that is sandwiched by the crust and core, believed to consist of hot, dense silicate rocks (such as olivine). All terrestrial planets, a number of asteroids, and some planetary moons have mantles. Definition is my own, informed by Wikipedia.
- Mars Orbiter Laser Altimeter
-
An instrument that measured Martian surface heights from aboard the Mars Global Surveyor spacecraft, which orbited the planet for nearly a decade. To determine these heights, MOLA beamed laser pulses at Mars and measured the time it took them to return, resulting in a detailed topographic mapping of Mars. Definition is my own, informed by NASA and Wikipedia.
- normalize
-
The adjustment of values to a common scale, for purposes of comparison. Definition is my own.
-
olivine
/ ol-uh-veen, ol-uh-veen /
-
A greenish mineral common in many meteorites as well as within Earth’s mantle, composed of magnesium iron silicate. Definition is my own, informed by minerals.net. Image credit: Sandatlas; olivine rock shown is 6cm across (2.4 inches).
- seamount
-
A volcanically formed submarine mountain, the peak of which lies below sea level. Definition is my own, informed by NOAA.
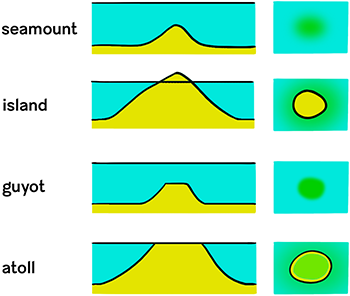
- shield volcano
-
A type of volcano formed almost exclusively by very liquidy lava flows, which result in the volcano’s characteristic broad, low-profile dome form. Definition is my own, informed by Oxford Languages and Wikipedia.
- spectral signature
-
The pattern of reflected light (including light beyond the visible spectrum) that identifies a chemical or compound. Materials can be distinguished from one another at a distance by examining which portions of the spectrum they reflect and absorb. Definition is my own, informed in large part by ESRI.
- sublimation / suhb-luh-mey-shuh n /
-
The process of a substance changing phases from solid directly to gaseous form, skipping the liquid phase. Definition is my own, informed by past science classes! Image credit: gfycat.com.
-
Tharsis Montes
/ thahr-sis mon-teeze /
-
Three large shield volcanoes in the Tharsis region of the planet Mars. From north to south, the volcanoes are Ascraeus Mons, Pavonis Mons and Arsia Mons. Mons (plural montes) is the Latin word for mountain. Definition is my own, informed by Wikipedia.
- TOPEX/POSEIDON satellite
-
A joint satellite mission between NASA and CNES (the French space agency) to map ocean surface topography. Launched on August 10, 1992, it was the first major oceanographic research satellite. Definition paraphrased from Wikipedia.
- triple point
-
The pressure and temperature at which a given substance can exist as either solid, liquid, or gas. Definition is my own, informed by YouTube’s Science Channel.